
What Does a Rising CA 19-9 Trend Suggest?
A single CA 19-9 number, taken in isolation, only tells part of the story — but a number that keeps climbing across two, three, or four consecutive tests is a genuinely different kind of signal, and it's read very differently by the doctors who order this test most often: those already treating or monitoring someone for pancreatic cancer. If you or someone you're caring for is having CA 19-9 checked repeatedly, whether after surgery, during chemotherapy, or as part of watching a pancreatic cyst, a rising trend understandably raises the stakes of every new draw. The reassuring nuance is that "rising" isn't a single, simple alarm bell — how much it's rising, how fast, and in what clinical context all change what it actually suggests. This article walks through why doctors track this number serially in the first place, how large a rise actually has to be before it's considered meaningful, why a temporary uptick doesn't always mean the cancer is progressing, and what happens next when a trend genuinely does keep climbing.
Curious what the rest of your bloodwork is telling you? Upload your results and get a complete, plain-language breakdown in under 15 minutes.
Analyze My ResultsWhy Doctors Track This Number Over Time, Not Just Once
CA 19-9 is used very differently depending on the situation. As a standalone screening test in someone with no prior diagnosis, it's unreliable — too many benign conditions can nudge it up, and it isn't accurate enough to detect cancer in people without symptoms or risk factors. Its real strength shows up after a diagnosis already exists: following surgery to remove a pancreatic tumor, during chemotherapy for active disease, or while monitoring a pancreatic cyst that might eventually turn cancerous. In every one of these situations, a single value matters far less than the pattern across repeated draws, which is why protocols typically call for checking it every one to three months during active surveillance, timed alongside imaging studies like CT scans every three to six months. The number becomes a kind of ongoing conversation with the disease rather than a one-time verdict, and a trend — not a single data point — is what that conversation is actually about.
How Much of a Rise Actually Counts as Meaningful
Not every uptick between two blood draws is clinically significant, since some month-to-month variation is simply normal. Researchers have worked to define exactly how much of a rise should be taken seriously, and the most well-validated threshold used after pancreatic cancer surgery is a relative increase of roughly 2.6 times the first postoperative value — meaning the number needs to roughly double, then some, before it's treated as a genuine warning sign rather than noise. Some studies have found that a 2.45-fold increase carries a positive predictive value of about 90% for recurrence, meaning nine out of ten patients who cross that threshold do turn out to have disease coming back. This is exactly why doctors don't react to any upward movement at all — they're watching for a specific, validated magnitude of change relative to where a person's own baseline sits, not comparing the number to a population-wide "normal" range the way a first-time test would be.
The Early-Warning Advantage — Predicting Recurrence Before Scans Can See It
One of the most genuinely useful features of a rising CA 19-9 trend is timing. In studies following patients after pancreatic cancer surgery, roughly 88% of those who went on to have their cancer return showed a clear CA 19-9 elevation, and when researchers looked specifically at how sensitive and specific the marker was for catching recurrence within two years of surgery, they found sensitivity around 83% and specificity around 87%. What makes this especially valuable is lead time: a rising trend can show up two to ten months before a CT scan or other imaging is able to visually confirm that the cancer has returned, since a tumor typically needs to reach a certain size before it becomes visible on a scan, whereas a handful of actively dividing cancer cells can already be nudging a blood marker upward. Practically, this means a confirmed rising trend often prompts closer imaging surveillance well before there's anything to see, giving doctors a genuine head start rather than waiting for a scan to catch up to what the bloodwork has already been suggesting.
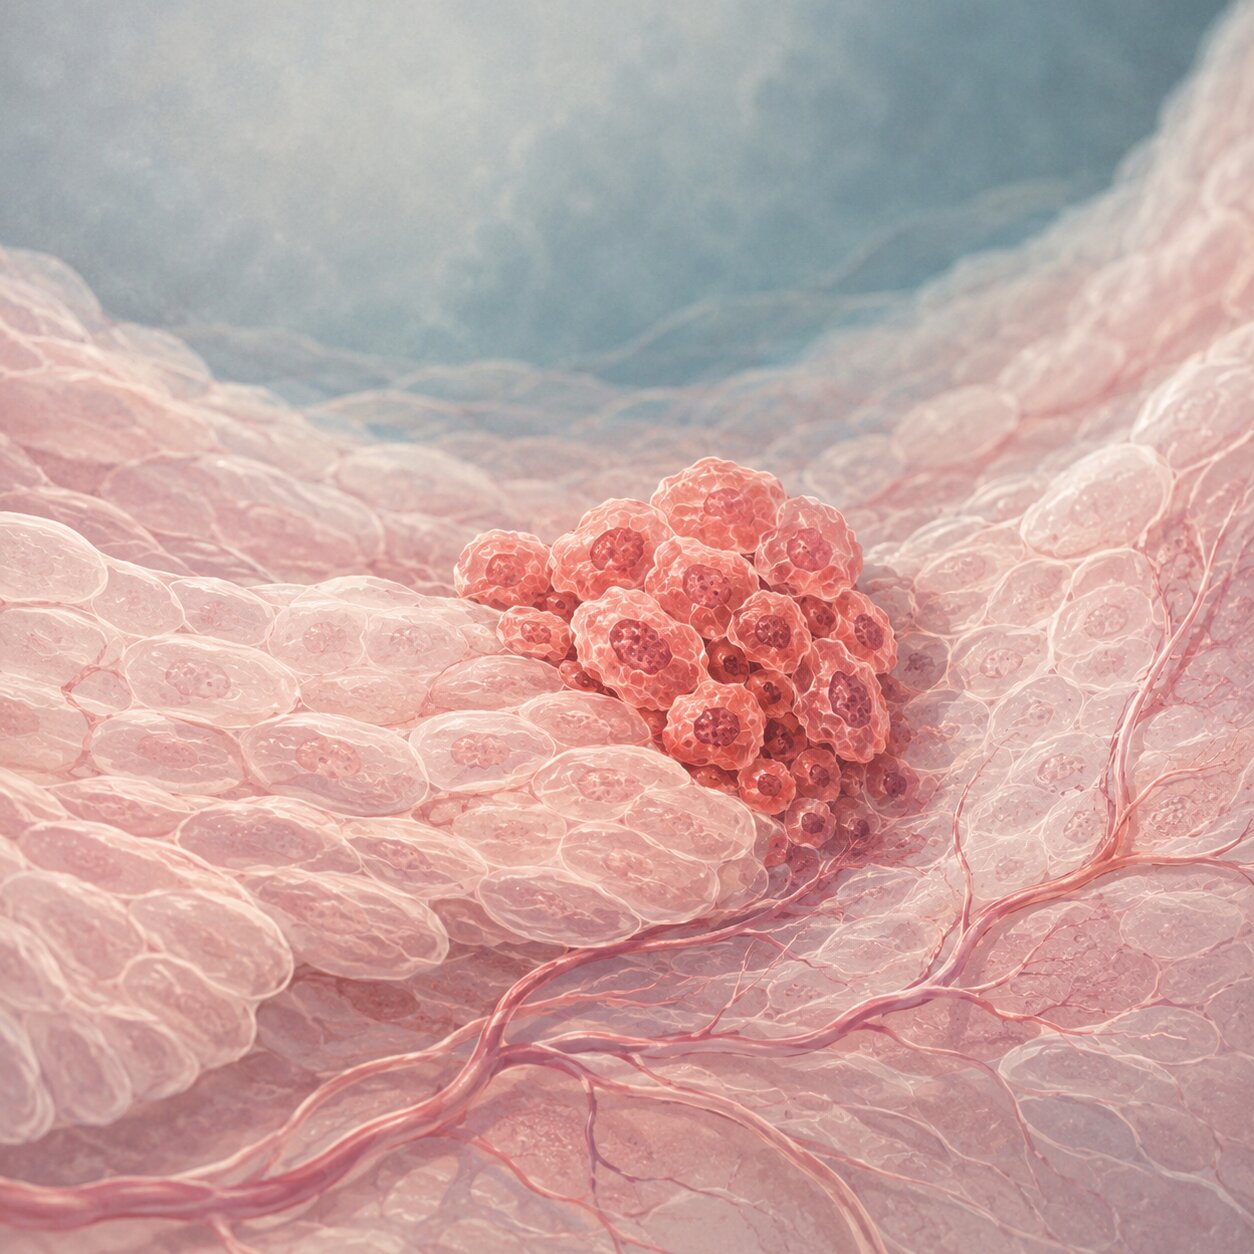
This lead-time advantage is also exactly why CA 19-9 is monitored so much more frequently than imaging during active surveillance. A blood draw is quick, inexpensive, and low-burden compared to a CT scan, so checking it every few weeks to months and watching the trajectory over several consecutive draws lets a care team catch the earliest hint of a genuine upward pattern, rather than only finding out once a scan already shows a visible mass. Two or three consecutive rises, each following the same upward direction, carry far more weight than a single higher-than-expected number sandwiched between two normal ones.
Not Every Rise Means Recurrence — the Chemotherapy "Flare" Phenomenon
Anyone actively receiving chemotherapy for pancreatic cancer should know about a well-documented and reassuring quirk: CA 19-9 can rise temporarily right after treatment starts, even when the cancer is actually responding well. This is sometimes called a tumor marker flare or surge, and it's thought to happen because dying cancer cells release extra CA 19-9 into the bloodstream as chemotherapy breaks them down — a short-lived side effect of treatment working, not evidence that it's failing. Research on this exact pattern found early transient CA 19-9 rises in just over half of patients treated with one common chemotherapy regimen, and in the cases researchers formally defined as a "surge" — at least a 20% rise from baseline followed later by at least a 20% drop — the entire episode consistently resolved in under 16 weeks. In one particularly striking case, a patient's level rose from roughly 2,300 U/mL to more than 90,000 U/mL over two months of treatment, only to decline and stabilize afterward as the same treatment continued, a pattern doctors now recognize as biochemical pseudoprogression rather than true disease progression.
Because of this well-known flare pattern, oncologists generally follow a specific rule of thumb: a rise in CA 19-9 shortly after starting a new treatment isn't acted on right away, and treatment decisions are typically deferred unless the marker keeps climbing continuously for six to seven weeks or longer. A single elevated draw taken right after a new chemotherapy cycle begins is, more often than not, simply too soon to interpret — which is exactly why doctors wait for a genuine, sustained pattern across several consecutive tests rather than reacting to any one result in isolation.
Other Reasons a Trend Can Tick Upward Without New Cancer Growth
Beyond the chemotherapy flare, a few other situations can push a previously stable CA 19-9 trend upward without the cancer itself progressing. Radiation therapy, for instance, has been documented to cause a delayed inflammatory reaction in and around treated tissue weeks to months after treatment finishes, and that inflammation alone can drive a noticeable, sometimes marked, CA 19-9 elevation that eventually settles once the inflammation resolves. The same ordinary, non-cancerous causes that can raise a first-time CA 19-9 result — gallstones, bile duct irritation, a coexisting liver condition, or even an unrelated infection — can just as easily nudge an existing trend upward in someone already being monitored for cancer, which is part of why doctors interpret any single rise in the context of a person's overall clinical picture rather than treating the marker as if it exists in a vacuum.
How Doctors Actually Interpret a Rising Trend, Step by Step
When a CA 19-9 trend does start climbing, the response is methodical rather than reactive. The first step is almost always a repeat test within a few weeks, simply to confirm the rise is real and not a one-off lab variation. If the second draw confirms the upward direction, doctors look at the magnitude of change relative to the person's own baseline — checking whether it approaches or crosses a validated threshold like the roughly 2.6-fold increase used after surgery — and weigh that against the clinical timeline, including whether the person recently started or finished chemotherapy or radiation, both of which can explain a temporary bump. If the trend still looks genuinely concerning after that context is considered, imaging is typically brought forward, since a confirmed rising marker is one of the clearest reasons to look sooner rather than waiting for the next scheduled scan.
This is also the point where doctors emphasize that no single tool works alone. CA 19-9 is treated as a highly sensitive early-warning system that prompts confirmatory action, not as proof on its own — a rising trend earns a closer look through imaging and clinical evaluation, but decisions about changing treatment are made using that fuller picture, never off the blood test in isolation. That combination of a sensitive early signal and a confirmatory follow-up is exactly what allows a rising trend to be taken seriously without triggering premature, anxiety-driven changes to a treatment plan that might actually be working.
Frequently Asked Questions
How much does CA 19-9 need to rise before it's considered a real trend?
There's no single universal number, but after pancreatic cancer surgery, a relative increase of roughly 2.6 times the first postoperative value is a well-validated threshold, and increases in that range have been linked to a high likelihood of recurrence. Doctors also weigh whether the rise is confirmed across more than one consecutive test.
Can CA 19-9 rise even when chemotherapy is working?
Yes. A temporary rise shortly after starting chemotherapy, sometimes called a flare or surge, happens in a substantial share of patients and is thought to reflect dying cancer cells releasing the marker, not treatment failure. These episodes typically resolve within about 16 weeks as the marker later declines.
How much earlier can a rising trend catch recurrence compared to a scan?
Research following patients after pancreatic cancer surgery has found that a rising CA 19-9 trend can appear two to ten months before imaging is able to visually confirm recurrence, since a tumor generally needs to reach a certain size before it's detectable on a scan.
Will my doctor change my treatment based on one rising result?
Generally no. A single rise, especially soon after starting or finishing chemotherapy or radiation, is typically confirmed with a repeat test and interpreted alongside the clinical timeline before any treatment decisions are made. Sustained increases over six to seven weeks or more carry far more weight than an isolated uptick.
Conclusion
A rising CA 19-9 trend is one of the more genuinely useful early-warning tools available in pancreatic cancer care, capable of flagging a possible recurrence months before imaging can see it — but "rising" covers a wide spectrum, from a brief, harmless flare during chemotherapy to a sustained, validated increase that warrants a closer look. What separates a trend worth worrying about from one that will resolve on its own comes down to magnitude, consistency across repeat tests, and the clinical context surrounding it — recent treatment, recent radiation, or an unrelated benign condition can all explain a temporary bump. If you or someone you're supporting is watching this number climb, the most useful step is the same one doctors already take: confirm it with a repeat test, place it in context, and let a full clinical picture — not one number on one day — guide what happens next.
Still Not Sure What Your Results Mean?
Upload your labs and get a complete, visual, plain-language interpretation of every biomarker — delivered to your inbox in under 15 minutes.
Get My ReportThis article is for educational purposes only and does not constitute medical advice. Always consult your healthcare provider regarding your specific lab results.