
A Blood Smear Can Reveal Conditions That Automated Analyzers May Miss
If your lab report ever came back with a note like "manual differential performed" or "reviewed by pathology," it's natural to wonder why a machine that can count thousands of cells a second needed a person to double-check its work. The honest answer is that modern hematology analyzers are extraordinary at counting and measuring, but counting and measuring are not the same thing as recognizing. A machine can report a platelet count, a red blood cell count, and a white blood cell count with impressive speed and precision, yet still completely miss a clump of platelets sticking together, a parasite hiding inside a red blood cell, or an early leukemia cell that looks almost — but not quite — like a normal one. That gap between what a machine measures and what a trained human eye can recognize is exactly why the blood smear, a decades-old technique involving nothing more advanced than a glass slide, a drop of blood, and a microscope, still has a permanent place in modern laboratory medicine. This article walks through the real, documented conditions and lab errors that automated counters can miss, why the miss happens on a technical level, and how the manual review process catches them before they become a missed diagnosis.
Curious what your own bloodwork is really telling you? Upload your results and get a complete, plain-language breakdown in under 15 minutes.
Analyze My ResultsHow an Automated Analyzer Actually "Sees" Your Blood
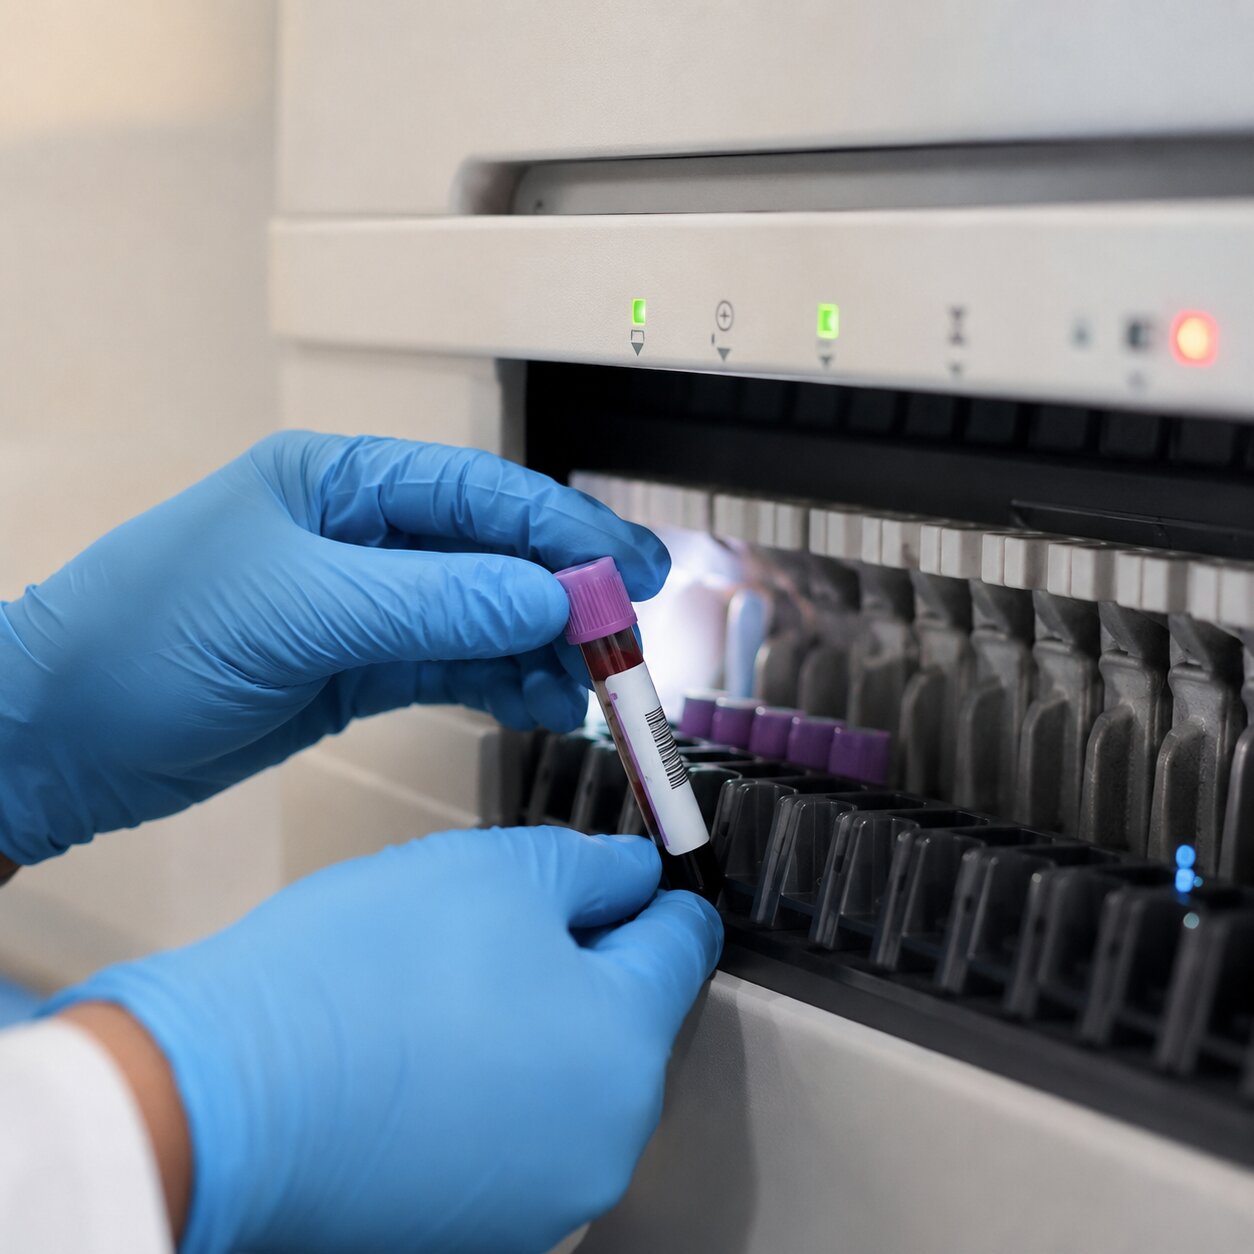
To understand what an automated analyzer can miss, it helps to understand what it's actually doing, because it isn't looking at your blood the way a person would. Most hematology analyzers work by drawing your blood sample through an extremely narrow channel, one cell at a time, and measuring each cell as it passes a detector. Some machines use electrical impedance, sending a tiny current through the channel and measuring the change in resistance as each cell interrupts it — bigger cells cause a bigger disruption, which is how the machine estimates size. Others use flow cytometry, shining a laser through each cell and reading how the light scatters and refracts, which gives clues about the cell's internal density and structure. Either way, the analyzer is running a very fast, very consistent statistical exercise: pass thousands upon thousands of cells through a sensor, sort the resulting signals into size and density categories, and report back counts and averages for each category. It can do this on a single tube of blood in under a minute, checking off more than twenty separate values that would take a person doing it by hand the better part of an afternoon.
What the analyzer is fundamentally not doing is looking at any single cell and asking, "does this look right?" It has no concept of shape in the way a person recognizes shape. It doesn't know what a healthy red blood cell's silhouette is supposed to look like, and it can't notice that one particular cell has an odd notch cut out of its edge or an unusual dark dot sitting inside it. It sorts cells into statistical buckets based on size and light-scatter signals, and as long as a cell's signal falls within an expected range, it gets counted as one more of whatever category it resembles most closely — even if a person looking at that same cell under a microscope would immediately flag it as abnormal. This is precisely why laboratories don't rely on the analyzer's raw output alone. Built into every modern analyzer is a system of flags: automatic alerts that fire when the numbers or the shape of a size-distribution graph look unusual enough to warrant a second look from a person. Those flags are the analyzer's own built-in admission that its statistical approach has limits.
Why a Perfectly Working Machine Can Still Give You the Wrong Picture
It's important to be clear that when an automated analyzer misses something, it isn't malfunctioning — it's operating exactly as designed, within a design that was never meant to replace direct visual inspection for every situation. A large systematic review of hematology analyzer performance found that the sensitivity of blast-cell flags, the alerts meant to catch immature white blood cells associated with leukemia, ranged anywhere from 18% to 100% depending on the specific analyzer, the patient population, and the study. That's an enormous range, and it means that in some settings, an analyzer's blast flag can miss more than four out of every five cases it should be catching. Flags for atypical or abnormal lymphocytes showed similarly wide variability. None of this is a secret hidden from laboratories — it's precisely why organizations like the International Society for Laboratory Hematology and the International Consensus Group for Hematology Review have spent years building formal, published rule sets that tell laboratories exactly which combinations of flags, counts, and patient factors should automatically trigger a manual slide review, rather than leaving that decision to chance or to an individual technologist's judgment on a busy day.
The deeper reason for this variability comes back to what the analyzer is actually measuring. A leukemia blast cell and a large, reactive lymphocyte responding normally to a viral infection can produce genuinely similar size and light-scatter signals to a machine, even though they mean two entirely different things for a patient's health. A person examining the same cell under a microscope is reading far more information at once — the texture of the chromatin inside the nucleus, the color and shape of the cytoplasm surrounding it, whether a distinctive rod-shaped structure called an Auer rod is visible inside, features that current analyzer technology simply isn't built to resolve at the level of a single cell. The analyzer isn't being lazy or careless; it's working within the physical limits of what impedance and light-scatter measurements can actually tell you, and those limits are exactly where the manual smear picks up the slack.
The Platelet Count That Wasn't Real: EDTA Clumping and Pseudothrombocytopenia
One of the clearest, best-documented examples of an automated miscount happens with platelets, the small cell fragments responsible for clotting. Most blood draws for a complete blood count go into a tube containing a chemical called EDTA, an anticoagulant that keeps the sample from clotting before it reaches the lab. In a small number of people — somewhere around 1 to 2 out of every thousand tested — EDTA triggers an unusual reaction in which naturally occurring antibodies cause platelets to clump together in visible clusters. To an automated analyzer, a clump of a dozen platelets stuck together simply looks like one much larger particle. Since platelets are defined and counted within a specific, narrow size window, a clump that size gets sorted right out of the platelet category entirely — the machine doesn't recognize it as "many small things stuck together," it just doesn't count it as a platelet at all. The result is a platelet count that can come back alarmingly low, sometimes low enough to suggest a dangerous bleeding risk, when the person's real platelet count is completely normal.
This isn't a rare curiosity buried in old textbooks — case reports describe patients whose surgeries were delayed, or who were nearly given unnecessary platelet transfusions, because a falsely low automated count was taken at face value without anyone checking the smear first. The giveaway sits in two places at once: the analyzer itself often throws a "platelet clump" flag and produces an oddly shaped, serrated histogram curve instead of the smooth bell curve it expects to see, and a technologist looking at the actual smear can immediately spot the clumps of platelets sitting together in the field of view, visibly separate from the properly dispersed single platelets nearby. Once clumping is confirmed as the cause, the standard fix is simple: redraw the blood into a tube with a different anticoagulant, such as sodium citrate, which doesn't trigger the same antibody reaction, and recount. This single scenario is a tidy demonstration of the bigger idea running through this whole article — the number on the printout isn't automatically the truth, and a five-second look at the slide is often all it takes to know whether it is.
When Cells Look Broken: Schistocytes and a Medical Emergency the Machine Can't Name
Some of the most urgent findings a blood smear can reveal aren't about counts being wrong at all — they're about a specific cell shape that a machine has no way to name, but which tells a doctor something serious is actively happening inside a person's blood vessels. Schistocytes are small, jagged, irregularly shaped fragments of red blood cells, sometimes described as looking like tiny helmets or triangles, produced when a red blood cell is physically sliced apart as it's forced past an obstruction inside a narrow vessel. Seeing several of them on a slide is one of the fastest, most specific clues available that a person may be experiencing a category of conditions called thrombotic microangiopathies — including thrombotic thrombocytopenic purpura, hemolytic uremic syndrome, and disseminated intravascular coagulation — all of which can become life-threatening within hours if they aren't recognized and treated quickly.
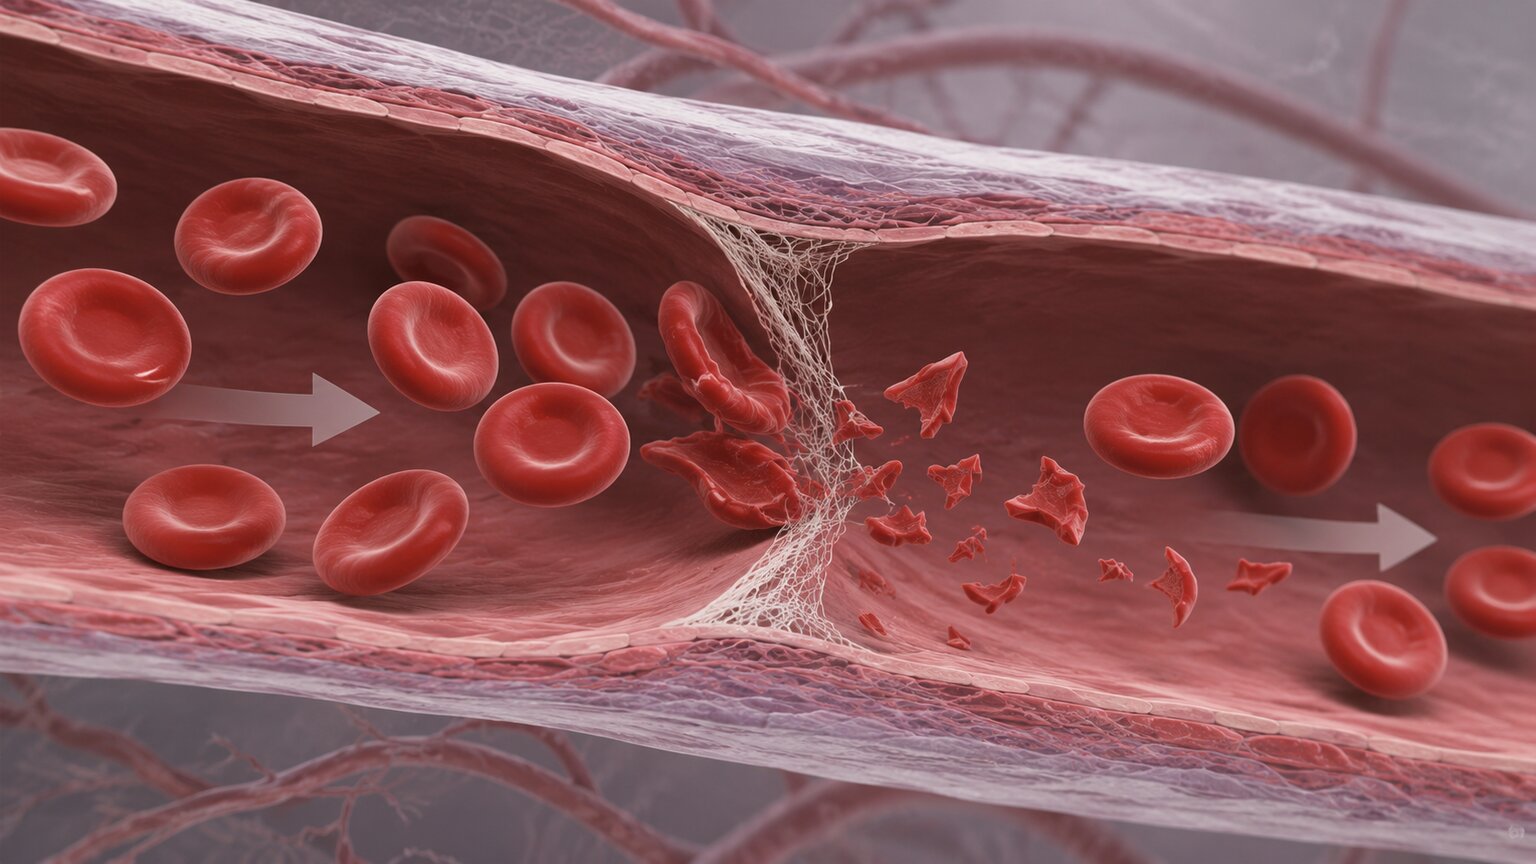
An automated analyzer can register that these fragments exist — enough of them will often nudge certain size-distribution values in a direction the machine flags as unusual — but it has no way to specifically identify "this is a schistocyte" versus any other odd-shaped debris in the sample. The clinical weight of that finding, and the speed with which it needs to reach a treating physician, depends entirely on a person recognizing the shape for what it is. This is part of why laboratories treat any analyzer flag suggesting abnormal red blood cell morphology as a priority for immediate manual review rather than something that can wait for a routine batch of slides later in the day; in a genuine thrombotic microangiopathy, the time between the blood draw and someone actually recognizing schistocytes under the microscope can meaningfully affect how quickly life-saving treatment, such as urgent plasma exchange, gets started.
Skewed Numbers: How Cold Agglutinins and Giant Cells Distort the Whole Report
Not every automated miss involves a completely wrong count — sometimes it's a whole cascade of subtly wrong numbers that only makes sense once someone looks at the actual cells. Cold agglutinin disease is a good example. In this condition, antibodies cause red blood cells to clump together specifically at cooler temperatures, and blood samples inevitably cool somewhat between the draw and the moment they reach the analyzer. When red blood cells clump, the machine's optics can mistake several clumped cells for one giant one, which throws off multiple values at once in a kind of chain reaction: the red blood cell count comes back falsely low, the average cell volume comes back falsely high, and because hemoglobin concentration is calculated using these other numbers rather than measured completely independently, the calculated MCHC value — the concentration of hemoglobin packed inside each red blood cell — can come back implausibly high, sometimes above what's biologically possible for a real red blood cell. A number that's biologically impossible is actually a helpful red flag in its own right, because a result like that essentially forces a second look rather than being accepted at face value.
Something similar, though gentler, happens with giant platelets. Certain bone marrow conditions and some inherited platelet disorders produce platelets that are unusually large — occasionally approaching the size of a small red blood cell. Since automated analyzers define the platelet category based on an expected size range, unusually large platelets can spill over into the size window the machine assigns to red blood cells instead, which quietly lowers the reported platelet count without ever triggering an obvious clump-style flag. A person scanning the same slide notices these platelets immediately, because their size stands out dramatically next to the much smaller, normal platelets scattered around them, and can note their presence directly on the report even when the automated number alone would have suggested a mild, unremarkable finding.
Catching Leukemia Before the Flag Is Certain
Blast cells are immature white blood cells that shouldn't normally appear in circulating blood at all, and their presence is one of the more urgent findings a blood smear can reveal, since they're strongly associated with acute leukemia. As mentioned earlier, published research shows enormous variability in how reliably automated blast flags actually catch these cells, with sensitivity ranging from below 20% to essentially 100% depending on the analyzer and the population studied. That gap matters enormously in practice, because a blast cell sitting just below whatever numeric threshold an individual laboratory's analyzer uses can pass through without triggering any flag at all, especially early in the disease process when blast numbers may still be relatively low.

This is where a human reviewer's ability to recognize features the machine can't measure becomes genuinely lifesaving rather than just a nice-to-have safety net. A blast cell has a distinctive appearance under the microscope: a large nucleus with fine, open chromatin, a thin rim of blue-staining cytoplasm, and sometimes a telltale rod-shaped structure inside called an Auer rod, which, when present, essentially confirms the cell as a myeloid blast rather than leaving room for ambiguity. None of these are things an impedance or light-scatter measurement can resolve — they require an actual visual read of the cell's internal structure. A pathologist noticing even a small number of unmistakable blasts on an otherwise unremarkable-looking automated report is exactly the kind of catch that turns a routine blood draw into an urgent same-day referral to hematology and oncology, sometimes before the patient has developed any symptoms severe enough to have prompted testing in the first place.
Telling a Virus From Something More Serious: Atypical Lymphocytes
Lymphocytes are a type of white blood cell central to fighting off viral infections, and when the body mounts a strong immune response — most classically to infectious mononucleosis, caused by the Epstein-Barr virus — some of those lymphocytes change appearance, becoming larger with more abundant, sometimes irregularly shaped cytoplasm. These are called atypical or reactive lymphocytes, and in the vast majority of cases, they're a completely normal, expected sign that the immune system is doing exactly what it's supposed to do. The catch is that, to an automated analyzer's size-and-scatter measurements, these enlarged reactive lymphocytes can look unsettlingly similar to abnormal lymphocytes seen in certain lymphomas and chronic lymphocytic leukemias — conditions that are anything but reassuring.
This is precisely the kind of situation where automated flags for "atypical lymphocytes" showed some of the widest performance variability in published research, and it's also exactly the kind of ambiguity a trained eye is built to resolve in ways a machine currently can't. A person examining the smear is weighing the specific pattern of cytoplasmic changes, the patient's age, the presence of other typical mono-related findings, and the overall population of lymphocytes on the slide — a mono-related reactive lymphocyte tends to show a heterogeneous mix of appearances from cell to cell, while a lymphoma or leukemia more often produces a strikingly uniform population of abnormal-looking cells, all resembling one another closely. That single distinction — variety versus uniformity across the slide — is something a machine's statistical bucket-sorting has no real way to capture, but it's often the first, fastest clue that separates "this is a common virus running its course" from "this needs an urgent hematology referral."
The Parasite the Machine Wasn't Originally Built to Find: Malaria
Malaria offers one of the starkest examples of why direct visual examination has remained the gold standard in a particular area of diagnosis for well over a century, even in the age of highly sophisticated automated equipment. The parasites that cause malaria spend part of their life cycle living directly inside red blood cells, and confirming the diagnosis — as well as identifying which of the several malaria-causing species is involved, and how heavily infected the blood is — has traditionally required a trained microscopist to examine a stained blood film directly and visually identify the parasites inside the cells. Standard hematology analyzers, built primarily around counting and sizing intact, uninfected-looking cells, were never designed with parasite recognition as a core function, and a lightly infected sample can pass through routine automated counting without triggering any specific alert at all.
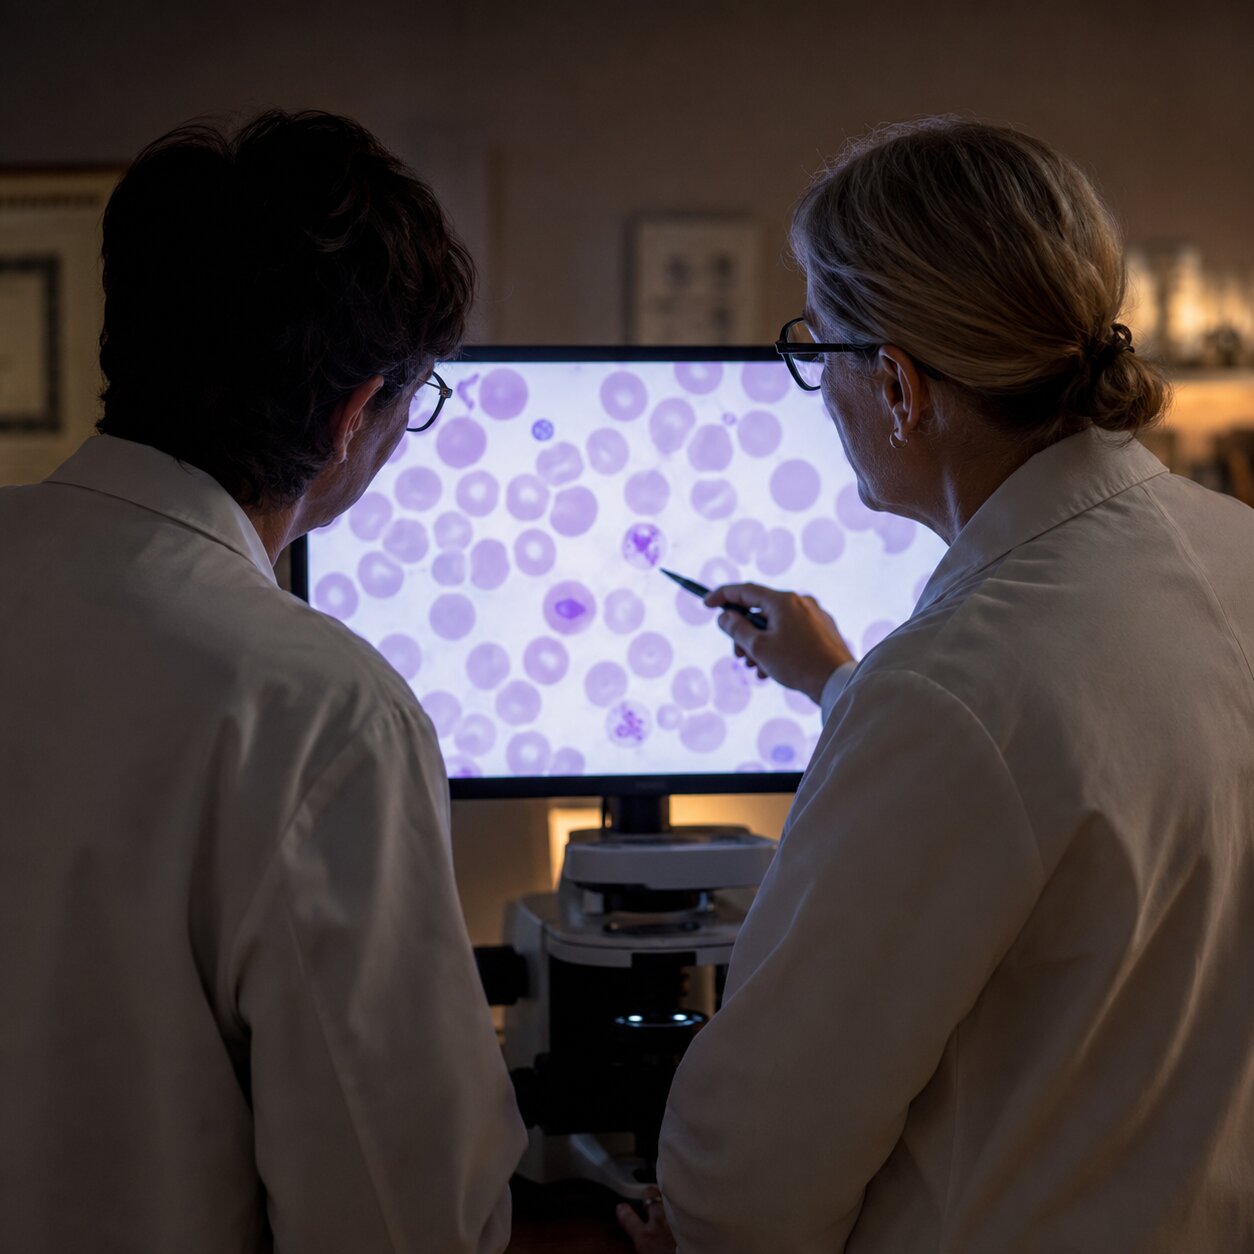
It's worth noting that this particular gap is narrowing, not widening: some newer-generation analyzers now use specialized fluorescent flow-cytometry channels specifically designed to detect infected red blood cells, and research testing these systems has found sensitivity meeting World Health Organization diagnostic standards in samples with a meaningful parasite burden. But that technology isn't universal across every lab, and even expert human microscopists have documented limits of their own — they can typically detect infection down to roughly 10 to 50 parasites per microliter of blood, while non-experts may only reliably catch infections at a much higher threshold, and even more sensitive molecular tests have shown that some low-level infections still slip past traditional microscopy entirely. The larger point holds regardless of exactly which method is used at a given facility: this is a case where the "count the cells and measure their size" approach that defines everyday automated hematology was never the whole story, and a specific, deliberate search for something the routine measurement wasn't designed to find remains an essential part of getting the diagnosis right, especially for anyone with a recent travel history to a malaria-endemic region and an unexplained fever.
Shape Clues an Analyzer Simply Can't Interpret
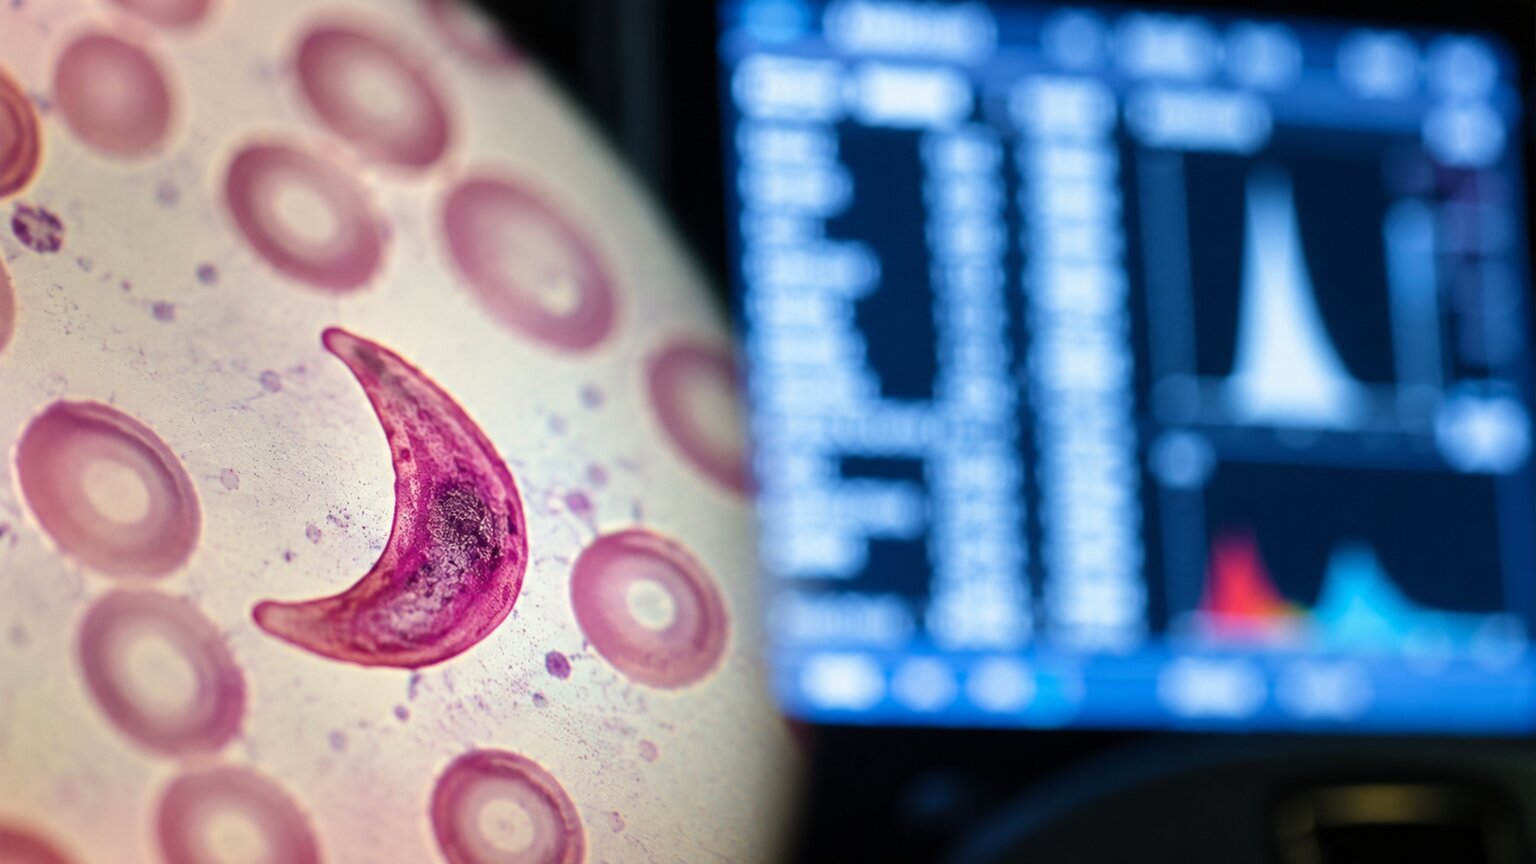
Beyond the specific emergencies and misleading counts covered above, there's an entire category of everyday findings that come down to shape alone — something a size-and-density measurement fundamentally cannot describe the way a visual read can. Sickle cells, the crescent-shaped red blood cells that give sickle cell disease its name, form when abnormal hemoglobin distorts a cell's structure under low-oxygen conditions; a machine may register these cells as smaller or oddly shaped in aggregate statistics, but it takes a person looking at the slide to say with confidence, "these are sickle cells," rather than simply noting that the red blood cell population looks unusually varied in size. Similarly, target cells — red blood cells with a bullseye-like ring of color inside a paler outer zone — can point toward liver disease, certain hemoglobin disorders, or a person's spleen having been surgically removed, but the specific bullseye pattern is a purely visual feature with no direct electrical or light-scatter equivalent a machine currently measures.
Teardrop-shaped red blood cells are another example, often signaling that the bone marrow itself is under structural strain, sometimes from scarring or from cells that don't belong there crowding out normal marrow tissue. And toxic granulation — coarse, dark granules appearing inside neutrophils, a type of white blood cell, during a significant bacterial infection or severe inflammatory stress — is a staining and texture pattern that a trained eye recognizes instantly but that has no clean numerical proxy in an automated report. None of these findings are things the analyzer is failing at through some kind of oversight; they're simply outside the category of information impedance and light-scatter measurements were ever built to capture, which is exactly why a shape-based, visual method remains irreplaceable for this whole category of clues.
When a Missing Spleen Leaves Its Own Fingerprint
Some of what a blood smear reveals isn't about catching an error or an emergency at all — it's about noticing a quiet clue that connects back to something in a person's medical history. The spleen normally acts as a kind of quality-control filter, removing small imperfections from red blood cells as they pass through, including tiny round remnants of genetic material left over from when the cell was still developing, called Howell-Jolly bodies. In someone whose spleen isn't functioning well, or who has had it surgically removed, these remnants are no longer cleared out, and they start showing up on the blood smear in noticeable numbers. An automated analyzer has no mechanism at all for recognizing this particular structure sitting inside an otherwise normally sized red blood cell; a pathologist, on the other hand, can spot Howell-Jolly bodies at a glance and use their presence as a meaningful clue toward a person's spleen function, sometimes surfacing a detail from years earlier — a childhood splenectomy, a case of undiagnosed sickle cell trait, or a condition affecting the spleen that hadn't yet been formally diagnosed — that turns out to be directly relevant to the reason blood was drawn in the first place.
The Rules That Decide Whether Your Blood Gets a Second Look
Given everything above, it's fair to ask how laboratories decide which samples actually get pulled for manual review, since examining every single blood draw under a microscope by hand would eliminate most of the speed and efficiency automated analyzers were built to provide in the first place. The answer is a set of formal, published rules developed specifically to strike that balance. In 2005, an international group of laboratory hematology experts known as the International Consensus Group for Hematology Review published a widely adopted set of criteria specifying which combinations of results should automatically trigger a manual smear review — thresholds like a white blood cell count far outside the normal range, a specific analyzer flag for blasts or abnormal lymphocytes, a red blood cell morphology flag rated moderate or greater in severity, or a first-time abnormal result for a patient with no prior blood counts on file to compare against.
These consensus rules aren't applied identically everywhere, and that's by design rather than an inconsistency to worry about. The International Society for Laboratory Hematology, which maintains and periodically updates this guidance, explicitly encourages individual laboratories to adapt the base rule set to their own patient population, their specific analyzer's known flag performance, and their local disease patterns — a cancer-treatment hospital, for instance, reasonably applies stricter review triggers than a routine outpatient lab serving a generally healthy population, simply because the odds of encountering a genuine blast cell are meaningfully higher in one setting than the other. What stays constant across every version of these rules is the underlying philosophy: let the automated analyzer handle the overwhelming majority of samples that come back unremarkable, and reserve skilled human attention specifically for the smaller subset of results where a person's judgment can meaningfully change the outcome.
What Actually Happens During a Manual Smear Review
When a sample gets pulled for manual review, a technologist or pathologist doesn't examine the entire slide with equal attention — they focus on a specific region called the monolayer, where the blood has spread thin enough that red blood cells sit separated from one another in a single layer, rather than overlapping in a way that would distort their apparent shape. Working under high oil-immersion magnification, the reviewer systematically assesses red blood cell size and shape, counts and classifies the different types of white blood cells present, and evaluates whether platelets appear adequate in number and normal in size — essentially repeating, with trained human judgment, several of the same categories the automated analyzer already reported, but checking whether the visual reality actually matches the numbers on the printout.

Any discrepancy or notable finding gets documented directly on the final report, which is why a report might list something like "occasional target cells noted" or "rare Howell-Jolly bodies seen" alongside the standard numeric values — those notes are the direct output of a human being looking at your actual cells, not an extension of what the automated portion of the test produced on its own. If you've ever received a lab report and wondered why some lines read as a specific description rather than just a number, that's very often exactly what happened behind the scenes: a person looked, and what they saw was worth writing down in words a machine could never have generated.
Frequently Asked Questions
Does every complete blood count get manually reviewed under a microscope?
No, and it isn't meant to. The vast majority of routine CBCs come back within expected ranges with no unusual flags, and those are reported directly from the automated analyzer without a manual review. Formal, published criteria — including thresholds for specific flags, extreme values, or a patient's first-ever abnormal result — determine which samples get pulled for a human to examine directly.
If my report doesn't mention a manual review, does that mean nothing was checked?
It usually means your automated results fell comfortably within the laboratory's established normal thresholds and didn't trigger any of the criteria that call for a closer look. Labs are still actively screening every sample against those rules — the absence of a smear note simply reflects that nothing about your numbers or flags met the bar for further review that time.
Can a blood smear catch something my automated CBC completely missed?
Yes, and it happens more than most people realize. Documented examples include falsely low platelet counts from clumping, malaria parasites in a lightly infected sample, early blast cells not yet numerous enough to trigger an automatic flag, and shape-based findings like schistocytes or sickle cells that machines have no way to visually identify on their own.
Should I ask my doctor to request a manual blood smear?
If you have unexplained symptoms, a family history relevant to blood disorders, or a CBC result that seems inconsistent with how you feel, it's a reasonable question to raise with your doctor. Many labs will already order one automatically based on your specific results, but bringing up your concerns directly ensures nothing falls through the cracks of an automated threshold that wasn't built with your specific situation in mind.
Conclusion
Automated hematology analyzers have transformed how quickly and affordably routine blood testing can happen, and for the overwhelming majority of blood draws, their speed and consistency are exactly what's needed — nobody wants to wait hours for a basic blood count that a machine can deliver in under a minute. But speed and precision aren't the same as judgment, and the specific conditions covered in this article — clumped platelets masquerading as a dangerously low count, a malaria parasite hiding inside red blood cells, an early leukemia cell that hasn't yet crossed a numeric threshold, a shape that instantly means something to a trained eye but nothing to a light-scatter sensor — are exactly the gap that a manual blood smear exists to close. If your own results ever come with a note that a person looked at your slide directly, that's not your lab falling back on an outdated method; it's the exact safety net modern laboratory medicine was deliberately built to include.
Still Not Sure What Your Results Mean?
Upload your labs and get a complete, visual, plain-language interpretation of every biomarker — delivered to your inbox in under 15 minutes.
Get My ReportThis article is for educational purposes only and does not constitute medical advice. Always consult your healthcare provider regarding your specific lab results.