
Understanding Anisocytosis on a Blood Smear Report
If a pathologist or lab technologist looked at your blood under a microscope and wrote "anisocytosis" on your report, they're describing a simple visual observation: your red blood cells aren't all the same size. Normally, red blood cells are remarkably uniform — like a jar of marbles all cut from the same mold. Anisocytosis means that jar now has some noticeably bigger marbles and some noticeably smaller ones mixed in among the normal ones. On its own, this word is not a diagnosis. It's a description of what the cells look like, and it's one of the oldest and most useful clues in laboratory medicine for figuring out why your blood might not be working exactly the way it should. This article walks through what anisocytosis actually means, how it connects to the RDW number on a routine blood count, what causes red blood cells to vary in size in the first place, how pathologists grade it, how the finding differs from related smear terms you might also see on your report, and what typically happens next once it shows up in your results.
What Anisocytosis Actually Means, in Plain Language
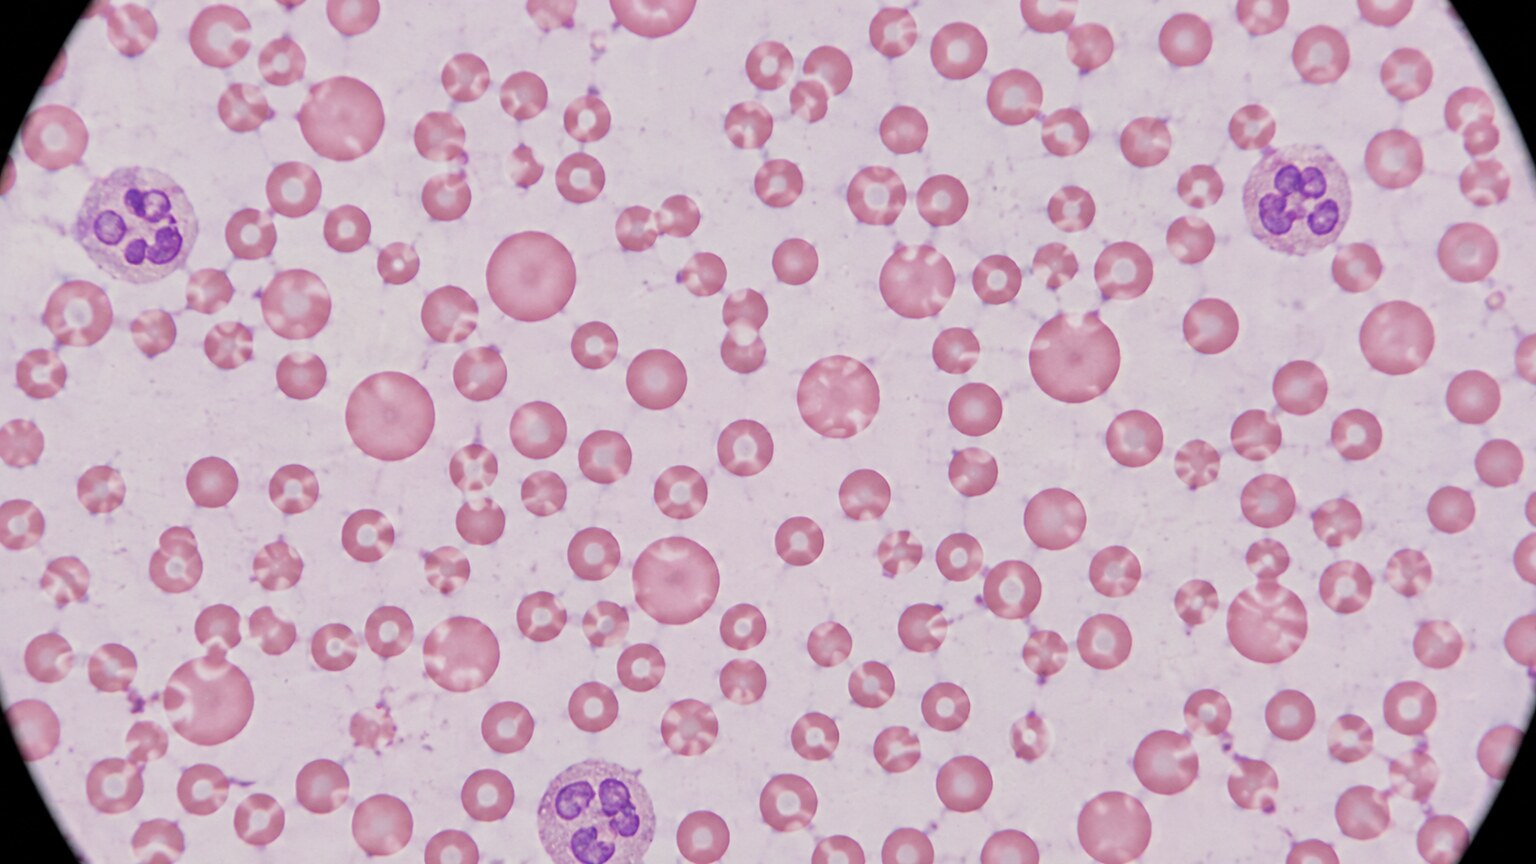
Figure 1. A blood smear showing anisocytosis: red blood cells of noticeably uneven diameter sitting side by side on the same slide.
The word itself comes from Greek roots: "aniso-" means unequal, and "-cytosis" refers to a condition of cells. Put together, anisocytosis literally translates to "unequal cells." In the context of a complete blood count (CBC) and blood smear, it always refers specifically to red blood cells, also called erythrocytes — the cells whose job is to carry oxygen from your lungs to every tissue in your body, and to carry carbon dioxide back for you to exhale. Under normal conditions, your bone marrow produces red blood cells on a tightly controlled production line, and the vast majority of them come out at almost exactly the same size, roughly 6 to 8 micrometers across — for comparison, a single human hair is about 70 micrometers thick, so we're talking about cells roughly ten times narrower than a strand of hair. When a pathologist reviews a slide and sees this size uniformity break down — some cells notably larger than that narrow range, some notably smaller — they note anisocytosis on the report.
It helps to think of your red blood cells as a factory's output. A well-run factory making a single, simple product turns out items that are essentially identical, batch after batch. If something changes upstream — a machine slips out of calibration, the raw materials running through the line change, or two different production runs suddenly get mixed together on the same conveyor belt — the finished products start showing size variation that wasn't there before. Anisocytosis is the blood equivalent of a quality inspector noticing that variation. It doesn't, by itself, tell you which machine slipped or which raw material changed; it tells you that something in the production process is worth investigating further, which is exactly why it's almost never reported alone. It's typically reported alongside a description of exactly what kind of size variation is present — cells that skew large, cells that skew small, or a genuine mixture of both — because that detail narrows the list of possible causes considerably.
How the RDW Number on Your CBC Connects to This
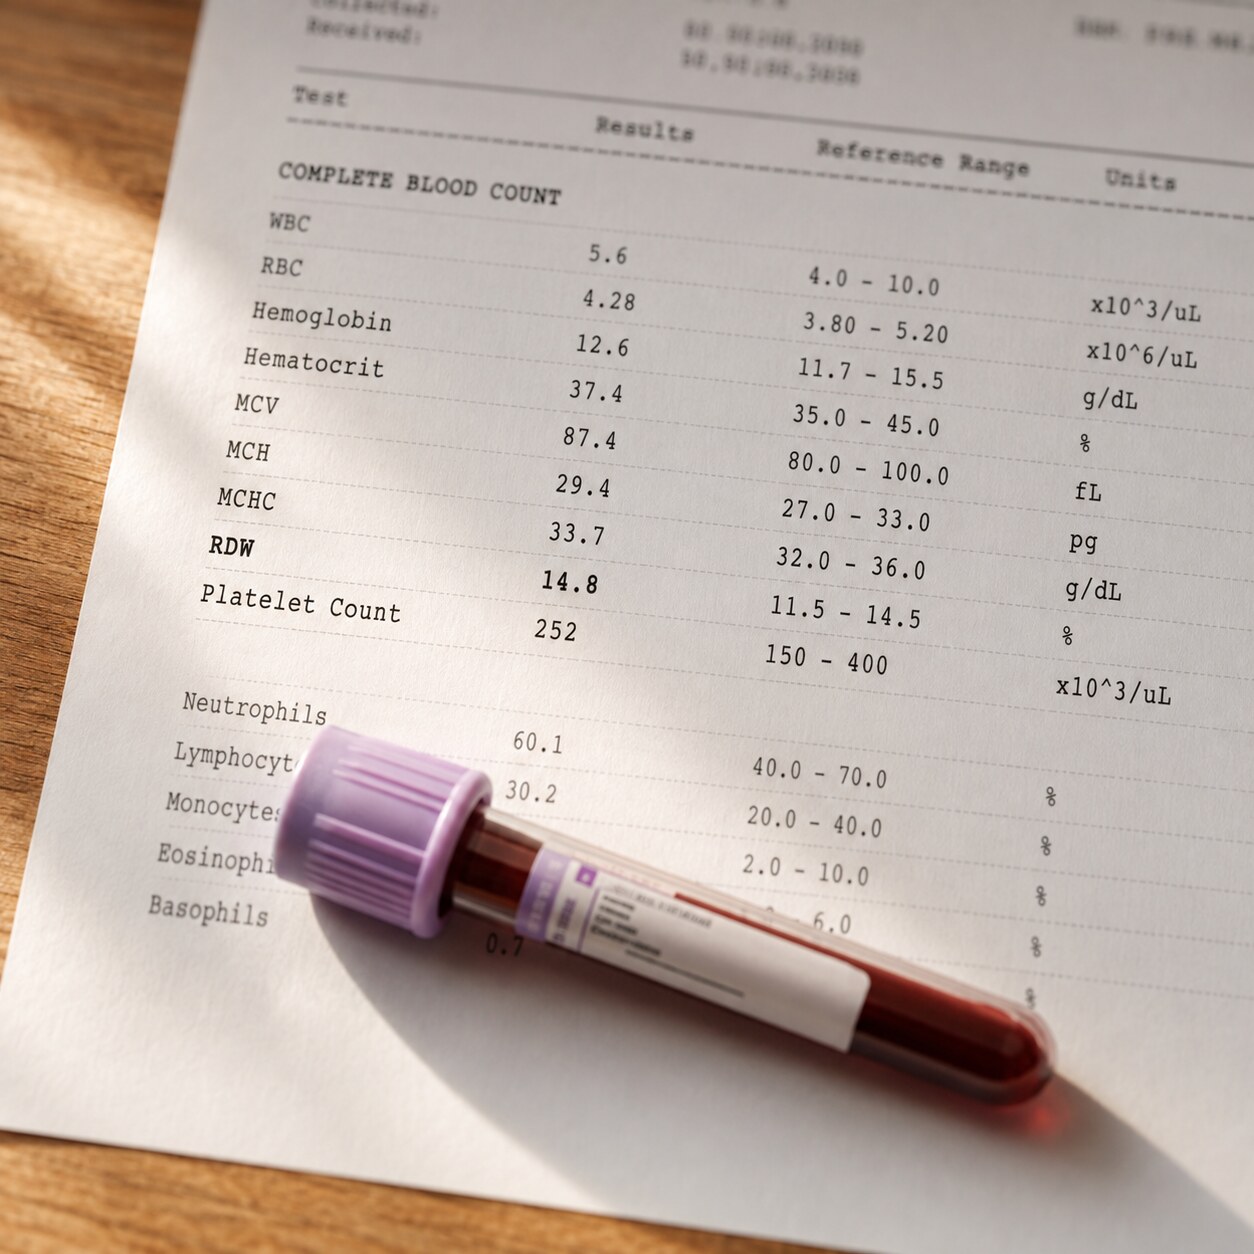
Figure 2. The RDW value on a standard CBC is the automated analyzer's numerical estimate of how much red blood cell size varies in a sample.
Long before a human being ever looks at your slide under a microscope, an automated hematology analyzer has already counted and measured tens of thousands of your red blood cells in a matter of seconds. As part of that process, it calculates a value called the Red Cell Distribution Width, or RDW, which appears as a standard line item on almost every CBC you'll ever receive. RDW is essentially a statistical measure of how spread out your red blood cell sizes are — a low, narrow RDW means your cells are clustered tightly around one size, while a higher RDW means there's more spread, more variation, from the smallest cells in the sample to the largest. In other words, RDW is the machine's numerical estimate of the exact same thing a pathologist is describing in words when they write "anisocytosis" after looking through a microscope.
This is why an elevated RDW on your CBC often triggers a manual review of the smear in the first place — the analyzer is flagging that something about your cell-size distribution looks unusual, and a trained eye is being asked to confirm that finding and describe it more specifically. The two pieces of information reinforce each other: RDW gives a precise, reproducible number that's easy to track over time and compare test to test, while the visual smear description adds texture the number alone can't capture, like whether the large cells are round or oval, whether the small cells are also pale, or whether there's a second, entirely separate population of oddly shaped cells mixed in. A radiologist reading an X-ray and a technician noting a measurement on a scanner are doing related but different jobs; RDW and the smear-based description of anisocytosis work the same way, together painting a fuller picture than either could alone.
When Red Blood Cells Skew Larger: Macrocytic Anisocytosis
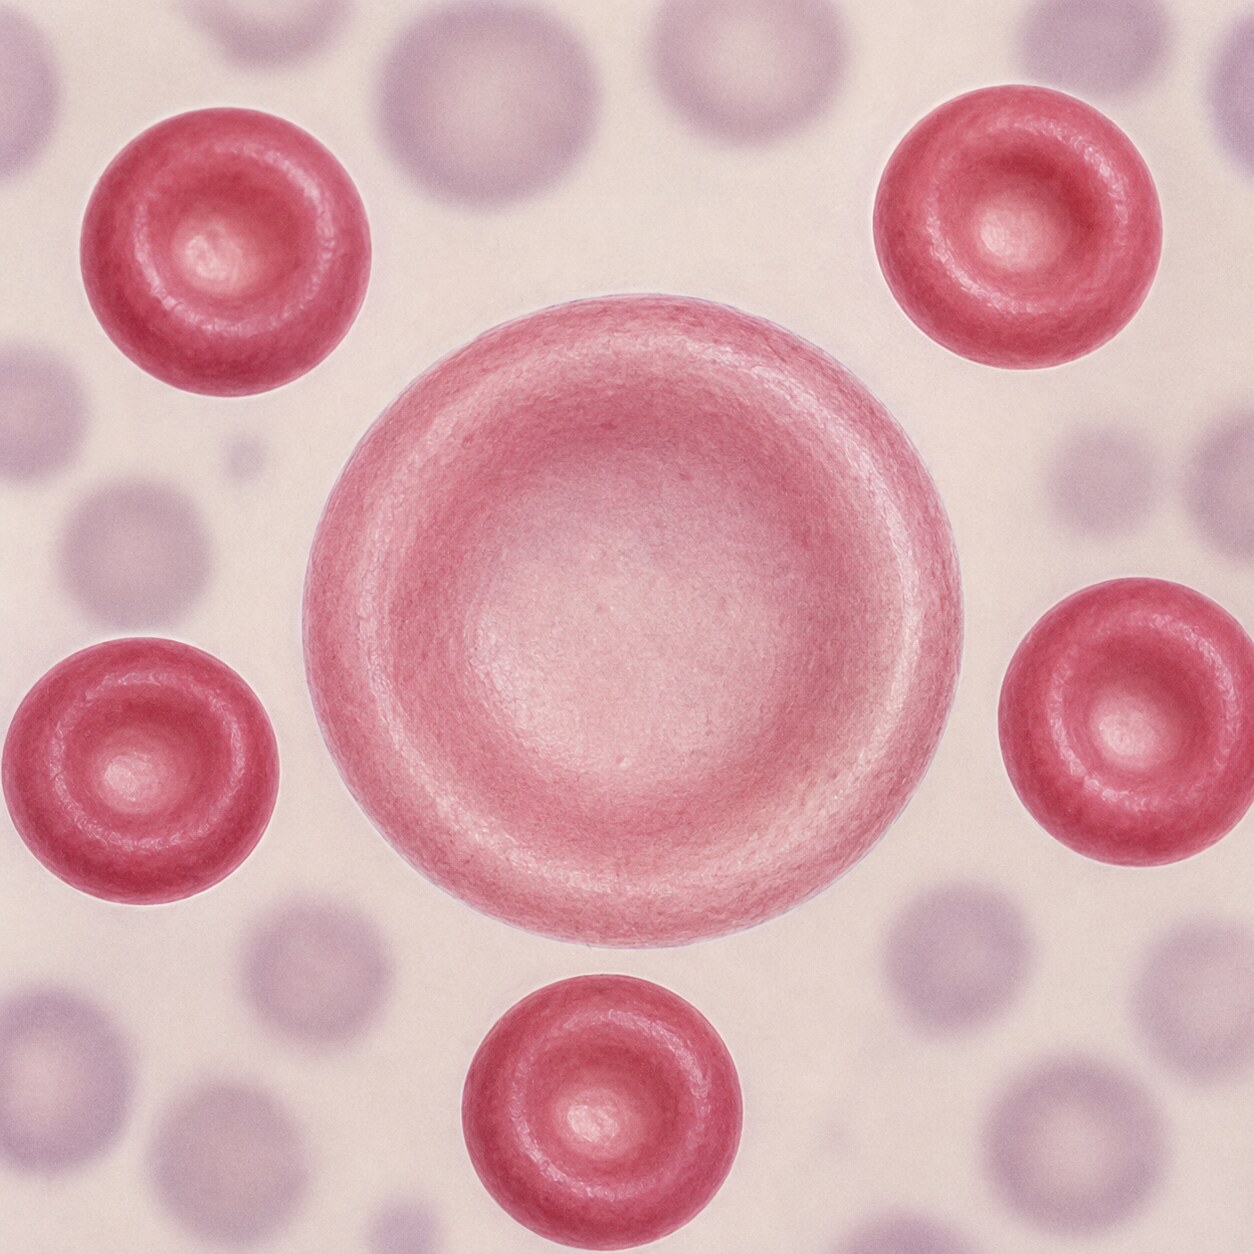
Figure 3. Macrocytic red blood cells, oversized relative to their normal-sized neighbors, commonly reflect a vitamin B12 or folate shortfall or accelerated new cell production.
When the size variation is driven mainly by cells that are too large — called macrocytes — the underlying cause usually falls into one of a few well-established categories. The most classic is a deficiency in either vitamin B12 or folate (vitamin B9), both of which are essential ingredients your bone marrow needs to finish assembling DNA correctly inside a developing red blood cell before it's released into circulation. Without enough of either nutrient, the cell's DNA-copying machinery stalls partway through, but the cell keeps growing in size regardless, producing what's called megaloblastic anemia — cells that are oversized because their internal maturation process got interrupted mid-build, like a house whose framing kept expanding while the electrical and plumbing work inside never finished on schedule.
Liver disease is another common driver of macrocytosis, largely because the liver plays a role in regulating the lipid composition of the red blood cell's outer membrane; when liver function is impaired, that membrane can take on extra surface area and the cell swells outward as a result. Excessive alcohol use produces macrocytosis through more than one mechanism at once — it interferes with folate metabolism, it can be directly toxic to developing bone marrow cells, and it frequently coexists with liver dysfunction, so heavy, sustained drinking is one of the more common reasons a physician sees macrocytic anisocytosis in an otherwise generally healthy-seeming adult. An underactive thyroid, some medications that interfere with DNA synthesis (including certain chemotherapy drugs and some antiretroviral or antiepileptic medications), and certain rare bone marrow disorders can also produce this same large-cell pattern, which is part of why a single elevated size range on a smear report so often prompts a broader look at diet, alcohol history, thyroid function, and medication list rather than a single targeted test.
There's also a completely different, and completely normal, reason large cells can show up: your bone marrow may simply be working overtime to replace red blood cells that were lost or destroyed faster than usual, whether from bleeding, an inherited blood disorder, or the immune system mistakenly attacking your own red cells. In that situation, the marrow releases young red blood cells called reticulocytes ahead of schedule, and reticulocytes are naturally somewhat larger than the fully mature cells they'll eventually become. A high reticulocyte count alongside macrocytic anisocytosis tells a very different story than a low reticulocyte count does — the former suggests the marrow is compensating appropriately for cell loss, while the latter points more toward a production problem happening upstream, inside the marrow itself.
Curious what the rest of your CBC or blood smear results are really telling you? Upload your results and get a complete, plain-language breakdown in under 15 minutes.
Analyze My ResultsWhen Red Blood Cells Skew Smaller: Microcytic Anisocytosis
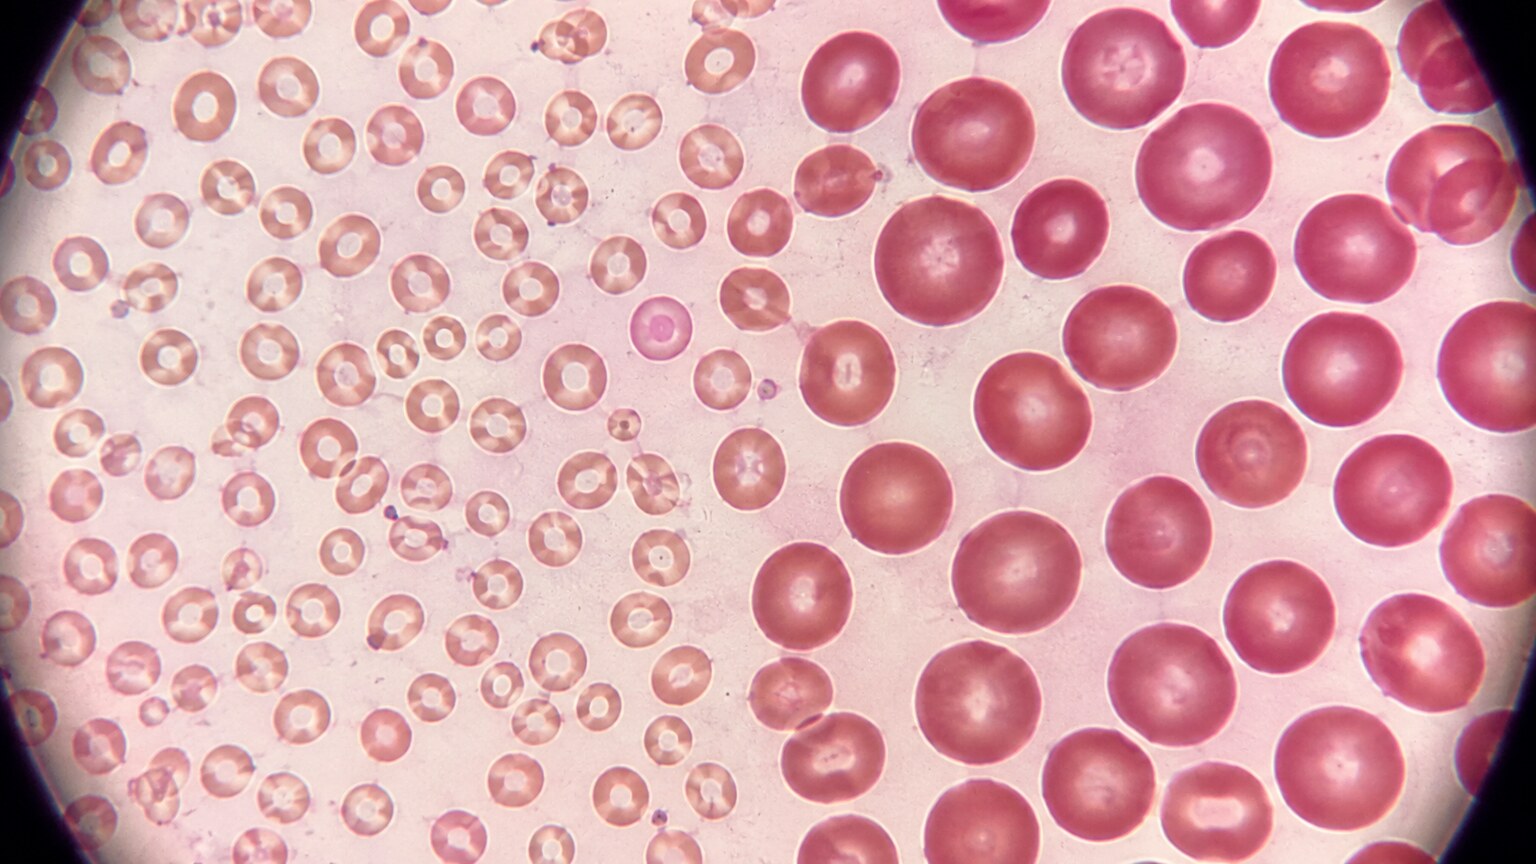
Figure 4. Microcytic red blood cells appear smaller and often paler than normal, a pattern most frequently traced back to iron deficiency.
On the opposite end, when the size variation is driven mainly by cells that are too small — called microcytes — iron deficiency is, by a wide margin, the most common explanation. Iron is a core structural ingredient of hemoglobin, the protein inside red blood cells that actually binds and carries oxygen, and when the bone marrow doesn't have enough iron on hand, it produces smaller cells with less hemoglobin packed inside them, which is also why microcytic cells frequently look pale under the microscope in addition to being undersized. Iron deficiency can come from inadequate dietary intake, from the body's inability to absorb iron properly (as can happen with certain digestive conditions), or from chronic blood loss — including sources a person might not think to mention, like heavy menstrual periods or slow gastrointestinal bleeding that produces no obvious symptoms at all.
Thalassemia, an inherited condition affecting how the body produces the protein chains that make up hemoglobin, is another significant cause of microcytosis, and it's an important one for a physician to distinguish from iron deficiency because the two require entirely different management — giving iron supplements to someone whose small cells are actually caused by thalassemia, rather than an iron shortfall, doesn't help and can occasionally cause harm from iron overload. Chronic diseases involving ongoing inflammation, such as some autoimmune conditions or long-standing infections, can also produce a milder microcytic pattern, because the body's inflammatory response interferes with how iron gets moved around and used even when total iron stores in the body are technically adequate. This is part of why a microcytic pattern on a smear, much like a macrocytic one, tends to prompt a specific, logical next round of testing — iron studies, hemoglobin electrophoresis, and inflammatory markers, among other tests — rather than a guess.
Mixed Anisocytosis: When Big and Small Cells Appear Together
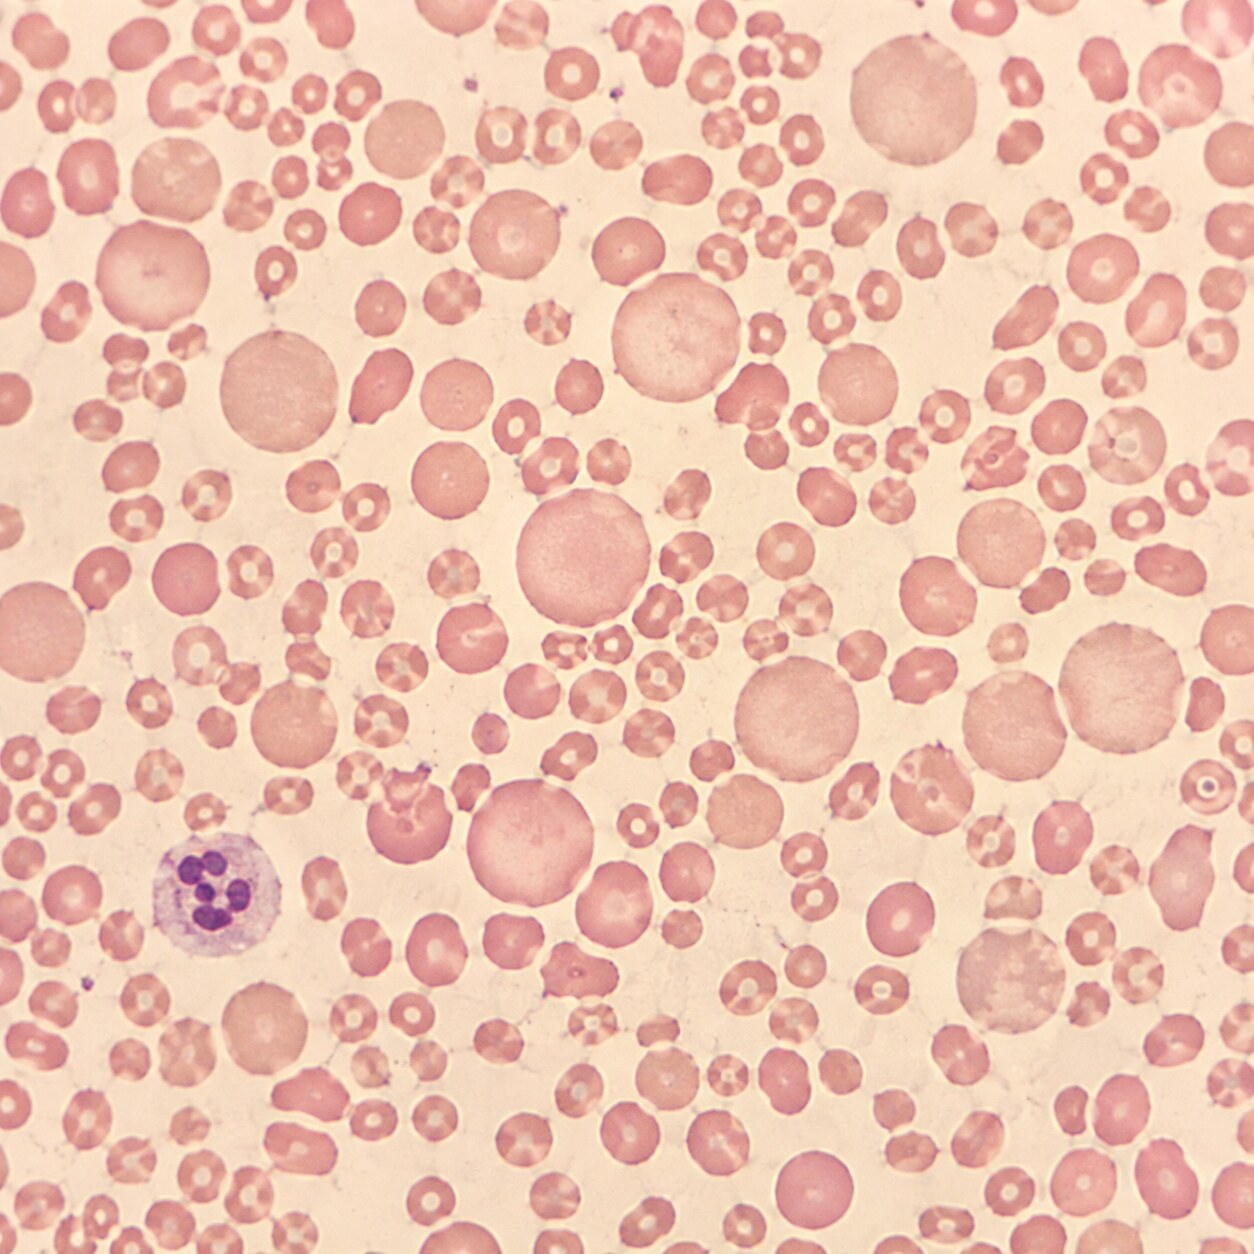
Figure 5. A dimorphic smear, showing two distinct red blood cell populations at once, often points toward two overlapping causes or a recent transfusion.
Sometimes a smear shows both patterns at once — a genuine mixture of cells that are too large and cells that are too small, sitting on the same slide, described in pathology terms as a dimorphic population. This particular combination is a valuable clue in its own right, because it often means two separate processes are happening simultaneously rather than one single cause. A classic example is someone with both iron deficiency and a folate or B12 deficiency at the same time — perhaps from a poor overall diet, or from a digestive condition that impairs absorption of multiple nutrients at once, such as celiac disease or a history of certain gastric surgeries. In these cases, the RDW is often dramatically elevated even though the average cell size (a separate number called MCV) can look deceptively close to normal, because the two opposing size shifts partially cancel each other out in that single average — which is exactly why RDW and MCV are always meant to be read together, and why the visual smear description matters even more in these mixed cases than in a straightforward large-cell or small-cell picture.
A dimorphic pattern can also show up after a recent blood transfusion, since a transfusion introduces someone else's red blood cells — which have their own separate, and possibly different, size distribution — directly into a person's bloodstream alongside their own native cells. In this scenario, the mixed appearance isn't a sign of disease at all; it's simply the expected, temporary result of two distinct populations of cells briefly coexisting until the older or transfused cells are gradually cleared from circulation over their normal lifespan. This is one of several reasons a clinician reviewing a smear always wants context — recent medical history, recent transfusions, and current medications — rather than interpreting the visual pattern in isolation.
How Pathologists Grade the Severity of Anisocytosis
When a pathologist or laboratory technologist reports anisocytosis, they typically don't just note that it's present — they also grade how pronounced it is, most often using a simple scale of mild, moderate, or marked (sometimes written as 1+, 2+, or 3+). This grading is a semi-quantitative visual estimate, made by scanning across multiple fields of the slide and judging what proportion of cells fall meaningfully outside the normal, tight size range. Mild anisocytosis might mean a modest spread of a slightly wider range than usual, something that could be a subtle early signal or, in some people, simply a normal individual variation with no real significance at all. Marked anisocytosis, on the other hand, describes a slide where the size variation is obvious even to a casual glance, with large and small cells clearly and abundantly scattered throughout — a pattern that almost always correlates with a substantially elevated RDW and tends to point toward a more established, more advanced underlying process.
It's worth understanding that this grading, while systematic and based on training and experience, still involves an element of human visual judgment, which is part of why the same slide reviewed by two experienced technologists can occasionally receive slightly different grades — mild versus moderate, for instance — without either reviewer being "wrong." This is also why the grade on a smear report is almost never used as a standalone decision-making tool; it's interpreted together with the RDW value, the average cell size (MCV), the hemoglobin level, and the broader clinical picture, including symptoms, diet, medication history, and any known chronic conditions. Think of the grade less like a precise measurement and more like a radiologist's descriptive impression of an X-ray — genuinely informative, grounded in real expertise, but always meant to be read in context rather than as an isolated verdict.
How the Blood Smear Itself Is Prepared and Read
It's worth understanding the mechanics behind this finding, because knowing how a smear is actually made explains why some things can affect the result that have nothing to do with your health at all. To prepare a blood smear, a technologist places a single small drop of blood near one end of a glass slide, then uses the edge of a second slide to spread that drop into a thin, feathered layer across the surface — the goal is a region where red blood cells sit in a single layer, not stacked or overlapping, so each one can be measured and judged individually rather than through a crowded cluster. The slide is then fixed and stained with a special dye combination, most commonly a Wright-Giemsa stain, which colors the different components of blood cells in contrasting shades so that red cells, white cells, and platelets all become clearly distinguishable under magnification. Without this staining step, blood cells under a microscope are nearly transparent and almost impossible to evaluate meaningfully.
Once stained, the slide is scanned first at lower magnification to get an overall sense of cell distribution and to pick a good region for detailed evaluation, then examined at high magnification — typically using a 100x oil-immersion objective lens, which is why you may occasionally see the phrase "oil immersion field" on a more detailed pathology report. The reviewer systematically moves across several fields of view in that ideal, single-layer region, mentally cataloging red blood cell size, shape, color, and any other notable findings as they go, before summarizing the overall pattern in the written report you eventually receive. This is also where technique matters: if the smear is spread too thick, cells can appear artificially crowded and distorted; if the blood sample sat too long before the slide was made, or if it wasn't handled at the correct temperature, cells can shrink, swell, or develop artificial spiky projections that have nothing to do with your actual physiology. A skilled technologist knows how to recognize and set aside these preparation artifacts rather than mistakenly reporting them as genuine anisocytosis, which is one of the quieter but important reasons blood smear interpretation is considered a skilled craft rather than a purely mechanical task.
Where New Red Blood Cells Come From — the Bone Marrow Connection
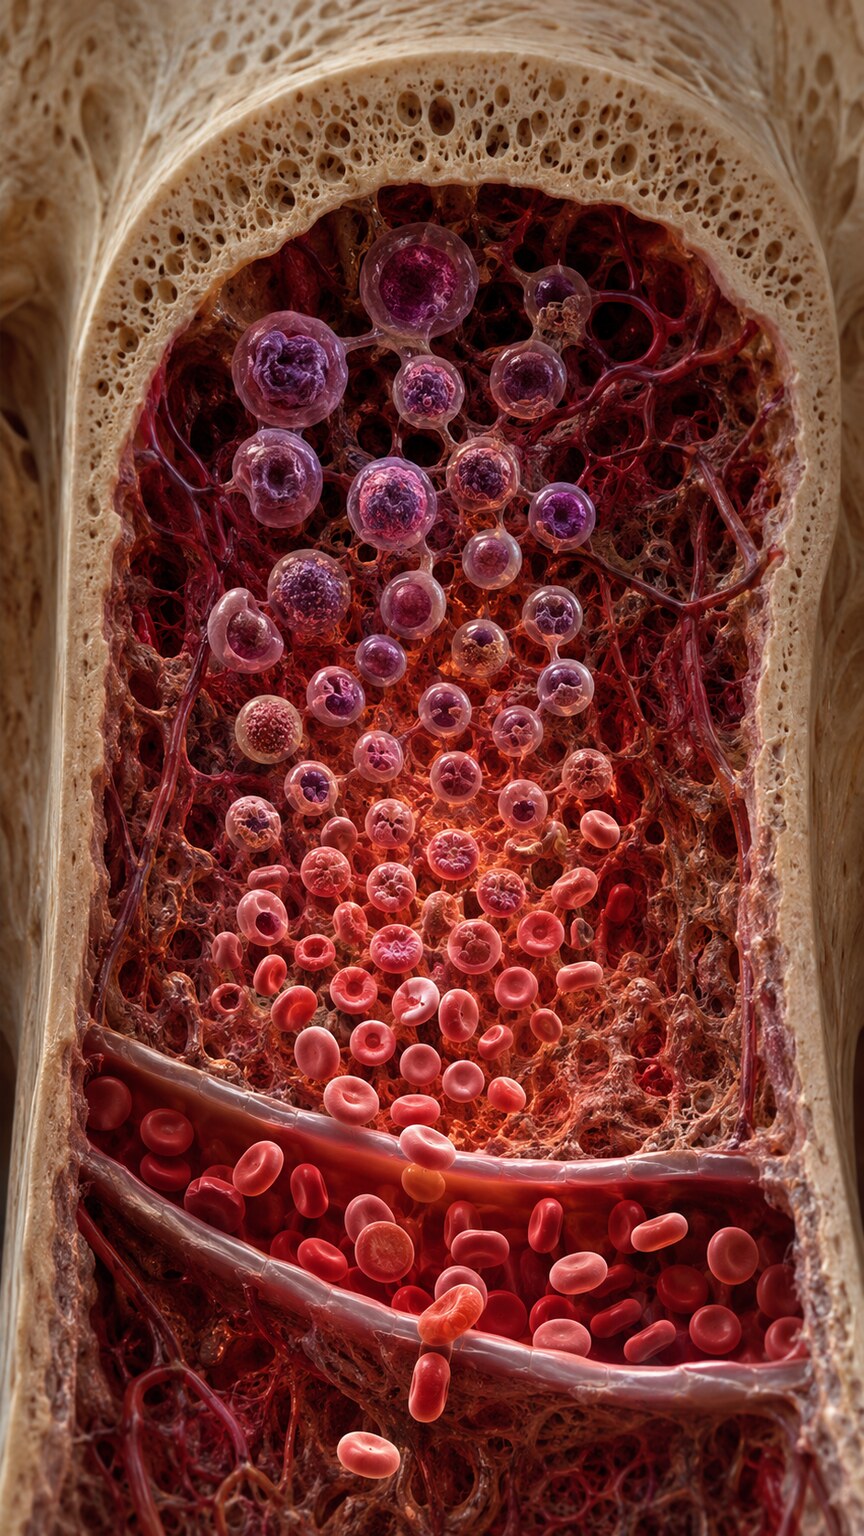
Figure 6. Every red blood cell in circulation began inside the bone marrow, where nutrient shortfalls or disrupted production can cause abnormal sizing from the very start.
To really understand why anisocytosis happens at all, it helps to walk through where red blood cells actually come from. They're manufactured inside your bone marrow, the soft, spongy tissue found in the center of many of your bones, especially the pelvis, spine, ribs, and breastbone in adults. A single type of parent cell there, called a stem cell, goes through a carefully sequenced series of maturation steps — dividing, shrinking, and eventually expelling its own nucleus — before finally becoming the flexible, disc-shaped, oxygen-carrying red blood cell that gets released into your bloodstream. This entire process takes roughly a week from start to finish, and under healthy conditions, it runs like a precisely timed assembly line, releasing new cells at a remarkably consistent size day after day.
Anisocytosis happens whenever something disrupts that assembly line's consistency. Sometimes the disruption is a missing raw material, as with iron, B12, or folate deficiency, where the marrow simply doesn't have what it needs to finish building cells to their normal, standard specification. Sometimes it's a genetic instruction that's slightly different from the standard blueprint, as with thalassemia, so the cells that come off the line are built to a permanently different size from birth. And sometimes the marrow itself is being pushed to work faster than usual, releasing cells before they're fully mature, as happens when the body is compensating for blood loss or cell destruction elsewhere. In each case, the resulting size variation you see on a smear is really a downstream reflection of whatever is happening much further upstream, back at the source where the cells were first assembled — which is exactly why anisocytosis is such a useful diagnostic clue: it's essentially a visible echo of an invisible production problem.
Conditions Commonly Linked to Anisocytosis
Because anisocytosis is a description of an effect rather than a specific disease itself, the list of conditions associated with it is genuinely broad, and it's worth seeing that breadth laid out plainly rather than left vague. On the nutritional side, iron deficiency anemia, vitamin B12 deficiency, and folate deficiency are the three most frequently identified underlying causes, together accounting for a substantial share of the anisocytosis seen in routine clinical practice. On the inherited side, thalassemia and, less commonly, some forms of sickle cell disease can produce their own characteristic size-variation patterns, often present from childhood rather than developing later in life. Chronic diseases involving ongoing inflammation, kidney disease affecting the hormone that stimulates red blood cell production, liver disease, and hypothyroidism each contribute their own distinct mechanisms, as described in earlier sections. Myelodysplastic syndromes, a group of bone marrow disorders more common in older adults, can also produce prominent and sometimes quite marked anisocytosis, which is one reason a persistent, unexplained pattern in an older patient is generally taken seriously and investigated rather than dismissed. Finally, recent blood transfusion, active bleeding, and certain medications round out the list of common contributors. No single item on this list can be assumed from the finding of anisocytosis alone — the point of listing them is to show why your own clinician will typically want to look at your full blood count, your symptoms, and your history together before narrowing things down, rather than reacting to one unfamiliar word in isolation.
Age and life stage also shape which of these causes is statistically more likely in a given person. In infants and young children, iron deficiency from diet transitions and rapid growth is a leading cause of a small-cell anisocytosis pattern, while inherited conditions like thalassemia, when present, are typically identified early in life through newborn screening or family history rather than discovered unexpectedly in adulthood. In adults of reproductive age, heavy menstrual bleeding is one of the more commonly overlooked contributors to iron deficiency, one that's easy for both patients and clinicians to underestimate until it's specifically asked about. In older adults, chronic disease, medication effects, and bone marrow disorders make up a larger share of the picture, which is part of why a new finding of anisocytosis later in life is generally evaluated somewhat more thoroughly than the same finding in an otherwise healthy young adult.
How Anisocytosis Differs From Poikilocytosis and Other Smear Terms
One source of confusion worth clearing up directly: anisocytosis is frequently mentioned in the same sentence as a related but distinct term, poikilocytosis, and the two are easy to mix up if you're reading a report without medical training. Anisocytosis is specifically about size — are the cells too big, too small, or a mix of both, compared to one another. Poikilocytosis is specifically about shape — are the cells taking on abnormal forms instead of the normal, smooth, round disc shape a healthy red blood cell should have, such as teardrop shapes, sickle shapes, or spiky projections. A single blood smear can show one of these findings without the other, both together, or neither at all, and a thorough report will typically describe them as separate observations because they can each point toward different, though sometimes overlapping, underlying causes. Iron deficiency, for instance, classically produces small, pale, and sometimes slightly elongated pencil-shaped cells, which means a report on iron deficiency might reasonably mention both anisocytosis and a mild degree of poikilocytosis in the same paragraph, describing two related but separately meaningful aspects of how the cells look.
Other terms that sometimes appear near anisocytosis on a report — anisochromia, describing variation in how darkly or lightly stained the cells appear, and polychromasia, describing a bluish tint in younger, still-maturing red blood cells — round out the fuller vocabulary a pathologist uses to paint a complete picture of what's happening on the slide. None of these terms are meant to stand alone; together, they function almost like a set of adjectives a reviewer uses to describe a scene as precisely as possible, so that anyone reading the report afterward — whether that's your primary care doctor, a specialist, or, eventually, you — can reconstruct a fairly accurate mental image of what the slide actually looked like without needing to view it directly.
What Happens After Anisocytosis Shows Up on Your Report

Figure 7. A follow-up review typically pairs the smear findings with additional targeted testing, such as iron studies or vitamin levels, to pin down the underlying cause.
If anisocytosis appears on your report, the practical next step almost always depends on what else is visible alongside it — the specific size pattern (large, small, or mixed), the RDW and MCV values, your hemoglobin level, and any other cell abnormalities the technologist noted while reviewing the slide. From there, a clinician typically orders a small, targeted panel of follow-up tests rather than an exhaustive workup: iron studies (including ferritin, a marker of your body's iron stores) if the pattern skews small; B12 and folate levels if it skews large; and sometimes a reticulocyte count, thyroid testing, or kidney and liver function tests depending on the fuller clinical picture. In many cases, especially with iron deficiency or a vitamin shortfall, the underlying cause is identified quickly and responds well to straightforward treatment — dietary changes, oral supplementation, or, when needed, addressing a source of ongoing blood loss.
It's also worth saying plainly that mild anisocytosis, particularly when everything else on the CBC looks normal and there are no symptoms, is sometimes a minor, non-specific finding that doesn't end up pointing to any significant condition at all — not every abnormal-sounding word on a lab report signals something serious. What matters most is the pattern taken as a whole, tracked over time if needed, and interpreted by someone who can weigh it against your full history. That's precisely the kind of context a single isolated term on a printed report can't provide on its own, which is why pairing a finding like this with the rest of your results, rather than reading it in isolation, makes such a meaningful difference in understanding what it actually means for you.
Tracking Anisocytosis Over Time
A single snapshot of anisocytosis, taken from one blood draw on one day, is useful, but the trend over multiple tests often tells a clearer story than any single result on its own. Because RDW is a precise numerical value, it's easy for a clinician to plot it alongside your other CBC values across several visits and watch how it moves in response to treatment or to changes in your health. If you're started on iron supplementation for a microcytic pattern, for example, one of the earliest measurable signs that treatment is working is often a rise in RDW before hemoglobin itself has fully recovered — because the marrow starts releasing a fresh batch of larger, more normally sized cells into a bloodstream that still contains your older, smaller cells, temporarily widening the size distribution even as the underlying problem is actively improving. A clinician who understands this pattern won't be alarmed by a rising RDW in that specific context; they'll recognize it as an encouraging early signal rather than a worsening one.
Conversely, a slowly climbing RDW over several routine checkups in someone without an obvious explanation — no recent treatment change, no diagnosed deficiency, nothing new in their history — is exactly the kind of subtle trend that can prompt a more thorough workup even before any single value crosses an official abnormal threshold. This is part of why routine annual blood work, even in someone who feels completely well, has real value: it's not just about catching a single dramatic abnormal number, but about noticing a gradual shift in a value like RDW that only becomes visible when you have several data points to compare rather than one isolated reading. Keeping your own past lab results accessible, and bringing them to follow-up appointments or comparing them yourself, is one of the more practical ways patients can help this kind of trend get noticed sooner rather than later.
Frequently Asked Questions
Is anisocytosis the same thing as anemia?
No. Anisocytosis describes size variation among red blood cells, while anemia refers to having too few red blood cells or too little hemoglobin to carry oxygen adequately. The two often occur together, since many of the same underlying causes — like iron or B12 deficiency — produce both abnormal cell sizes and low red blood cell counts, but a person can technically have one without the other, particularly in mild or early-stage cases.
Can anisocytosis go away on its own?
It depends entirely on the cause. If it's driven by a nutrient deficiency, correcting that deficiency through diet or supplementation typically allows red blood cell size to normalize gradually over the following weeks to months, since the bone marrow needs time to replace the abnormal cells with newly, correctly built ones. If it's driven by an inherited condition like thalassemia, the size variation is a lifelong, stable characteristic rather than something that resolves.
Does a high RDW always mean the smear will show anisocytosis?
Very often, yes, since RDW and visual anisocytosis are measuring the same underlying phenomenon through two different methods. However, RDW is calculated from tens of thousands of cells with high statistical precision, while a manual smear review only samples a portion of the slide by eye, so there can occasionally be small discrepancies between a borderline RDW value and what a reviewer happens to describe qualitatively.
Should I be worried if my report says "mild anisocytosis"?
Mild anisocytosis, especially with an otherwise normal CBC and no symptoms, is frequently a minor or non-specific finding rather than a sign of serious disease. That said, only a clinician reviewing your complete results and history can say for certain whether any follow-up testing is warranted in your particular case.
Can diet alone cause anisocytosis, or does it always mean something is medically wrong?
Diet alone can absolutely cause it — a sustained lack of iron-rich foods, or of foods containing B12 and folate, is enough on its own to eventually produce a measurable size-variation pattern, even in someone with no underlying disease. This is one of the more reassuring possibilities on the list, since it's often correctable through dietary changes or supplementation once identified, without pointing to a more serious chronic condition.
Will anisocytosis show up on a standard CBC, or does it require a special test?
The RDW value that reflects anisocytosis is already included on essentially every standard CBC, so no special or additional test is needed to detect that a size-variation pattern exists. A manual blood smear review, where a person actually looks at the cells under a microscope to describe the pattern in more detail, is typically only ordered as a separate follow-up step when the automated results suggest it would add useful information.
Conclusion
Anisocytosis is best understood not as a diagnosis in itself, but as a visible signal that your red blood cells aren't coming off the bone marrow's production line at their usual, consistent size — a clue that, paired with the RDW value, the direction of the size shift, and the rest of your blood count, can point efficiently toward a specific, often very treatable cause, whether that's a nutrient deficiency, an inherited trait, a chronic condition, or simply the marrow compensating for cell loss elsewhere in the body. Reading this single term in isolation from a printed report rarely tells the full story, since its meaning shifts considerably depending on exactly what kind of size variation is present and what else appears alongside it. Bringing the complete picture — your CBC values, your smear description, your symptoms, and your history — into one conversation with a healthcare provider is what actually turns a somewhat cryptic laboratory word into a clear, actionable answer, and in the great majority of cases, that answer turns out to be something straightforward, identifiable, and manageable rather than something to fear.
Still Not Sure What Your Results Mean?
Upload your labs and get a complete, visual, plain-language interpretation of every biomarker — delivered to your inbox in under 15 minutes.
Get My ReportThis article is for educational purposes only and does not constitute medical advice. Always consult your healthcare provider regarding your specific lab results.