
Understanding RDW: What a High Red Cell Distribution Width Means
Most numbers on a complete blood count answer a simple question: how much of something is in your blood. RDW, short for red cell distribution width, answers a completely different kind of question — not how many red blood cells you have, and not how big they are on average, but how much they vary in size from one cell to the next. A high RDW means your red blood cells aren't a uniform batch; some are notably smaller and some notably larger than they should be, all circulating together. That distinction matters enormously, because size variation is something your bone marrow only produces under specific circumstances, which makes RDW one of the more genuinely diagnostic numbers on a routine panel rather than just another value to glance past. This article explains what actually causes that variation, why it shows up in some conditions and not others, and how doctors use it alongside other numbers to narrow down what's really going on.
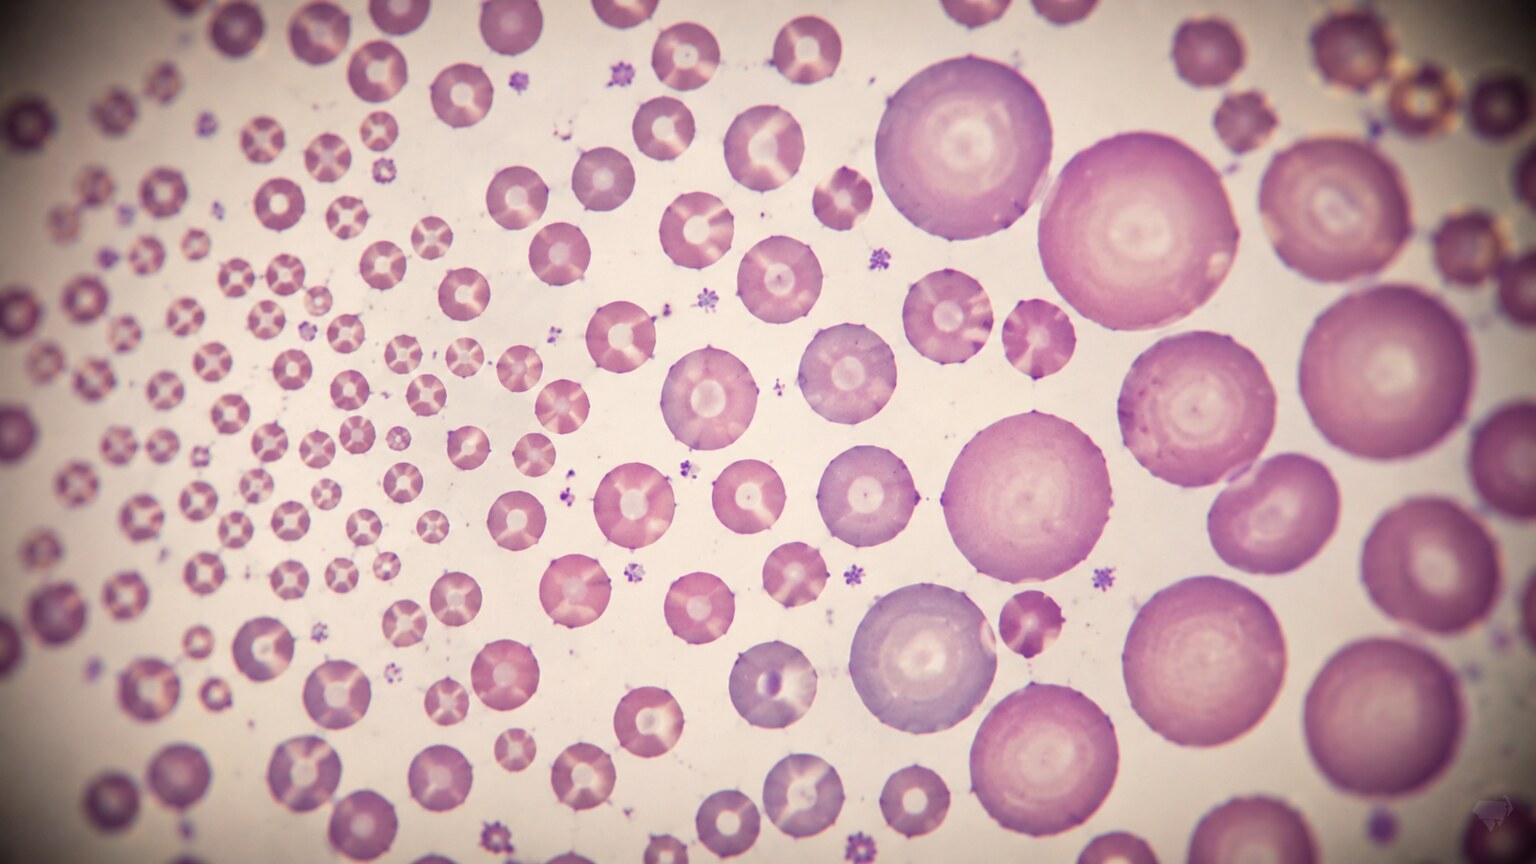
How a Machine Actually Measures "Width"
RDW isn't measured by a person squinting through a microscope counting big and small cells one by one — it's calculated automatically by the same hematology analyzer that runs the rest of your complete blood count, and understanding how it arrives at that number clarifies what it actually represents. As your blood sample passes through the machine, each individual red blood cell is measured for its volume, one at a time, across many thousands of cells in a matter of seconds. The analyzer then plots all of those individual measurements into a distribution curve, essentially a histogram showing how many cells fall at each size. Most of your red blood cells cluster tightly around a central, average size — that average is what shows up as MCV, or mean corpuscular volume, elsewhere on your panel. RDW captures something different: how wide or narrow that curve is, expressed as a percentage representing the coefficient of variation around that average. A tight, narrow curve means your cells are remarkably uniform and produces a normal RDW; a wide, spread-out curve, with cells scattered across a broader range of sizes, produces an elevated one.
Why Your Bone Marrow Would Ever Produce Cells of Different Sizes
Under normal, healthy conditions, your bone marrow runs something close to an assembly line, releasing red blood cells that are remarkably consistent in size, batch after batch, day after day. Size variation isn't a random glitch — it happens when something disrupts that assembly line's consistency, and broadly speaking, there are two ways that disruption occurs. The first is a supply problem: if the bone marrow doesn't have enough of a specific raw material, like iron, vitamin B12, or folate, to build cells properly, and that shortage develops gradually or partially, cells produced early in the shortage can look different from cells produced later, once the deficiency has worsened, resulting in a mixed population of sizes all circulating at once. The second is a demand problem: if red blood cells are being lost or destroyed faster than usual, from bleeding or a condition that breaks them down prematurely, the bone marrow responds by rushing new cells into circulation faster than normal — and these younger, prematurely released cells, called reticulocytes, are measurably larger than fully mature red blood cells, mixing in with the existing population and widening the size curve. In both scenarios, the underlying story is the same: something has interrupted the assembly line's normal consistency, and RDW is what picks that disruption up.
Curious what the rest of your complete blood count is telling you? Upload your results and get a complete, plain-language breakdown in under 15 minutes.
Analyze My ResultsIron Deficiency: The Most Common Cause of a High RDW
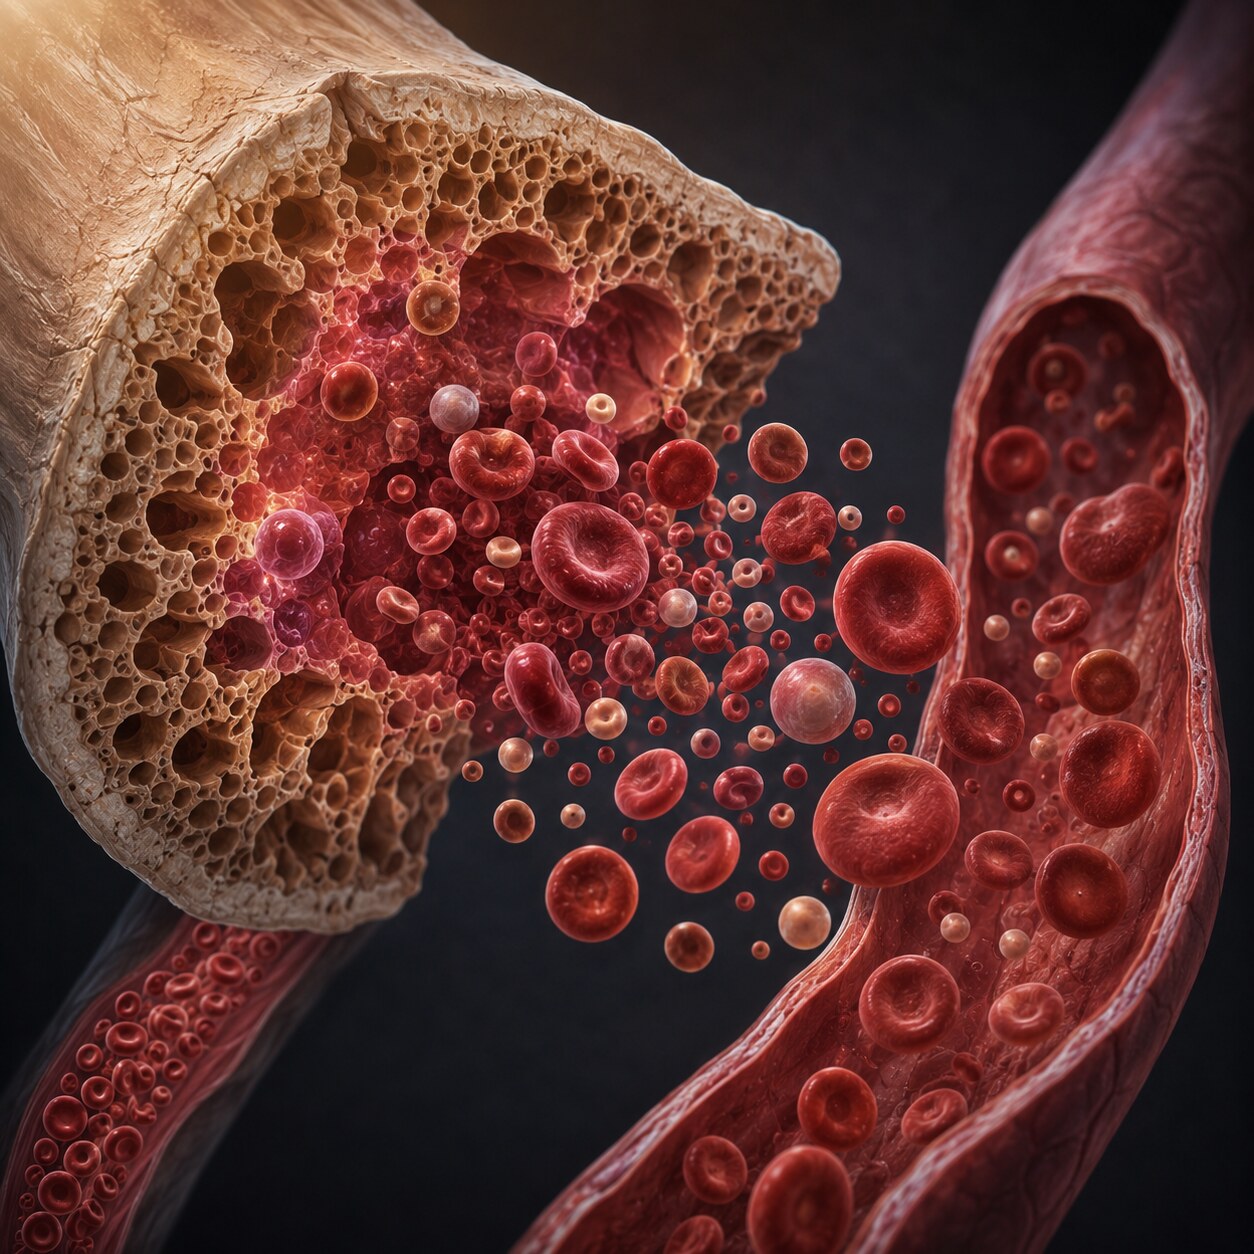
Iron deficiency is the single most common reason someone shows up with an elevated RDW, and the mechanism behind it explains a lot about why this number is so useful early in a workup. Iron is a core structural ingredient in hemoglobin, the protein that fills each red blood cell and carries oxygen — without enough of it, new cells get built smaller than normal, a change called microcytosis. But iron deficiency rarely develops overnight; it's almost always a gradual depletion, meaning the bone marrow keeps producing red blood cells throughout that decline, and cells made earlier in the process, when iron stores were still relatively adequate, are noticeably larger than cells made later, once the deficiency has become more severe. The result is a blood sample containing a genuine mixture: some closer-to-normal-sized older cells still in circulation, alongside progressively smaller newer cells, and that mixture is exactly what drives RDW upward. This is precisely why RDW often rises before MCV drops meaningfully below the normal range — the width of the curve widens well before its average shifts, making an elevated RDW paired with a low-normal or borderline MCV one of the earliest detectable signals of developing iron deficiency, sometimes before a person has any symptoms at all.
This early-warning quality is genuinely one of RDW's most practical strengths in everyday medicine, and it's worth understanding why timing works out this way. Hemoglobin and hematocrit, the numbers most people associate with anemia, only fall once the body's total iron reserves have been depleted enough that overall red blood cell production starts to lag meaningfully behind normal — a relatively late-stage sign of the problem. RDW, by contrast, reacts to the mixture of cell sizes currently circulating, which starts shifting the moment iron becomes even mildly insufficient for building new cells at full size, well before total production volume has been affected. A useful way to think about it: hemoglobin tells you the shortage has become severe enough to reduce the total supply, while RDW tells you the assembly line has already started cutting corners on quality. That earlier signal is exactly why an elevated RDW, even alongside completely normal hemoglobin, is sometimes enough on its own to prompt a doctor to check ferritin and other iron studies proactively, catching a developing deficiency well before it progresses to full-blown anemia.
Vitamin B12 and Folate Deficiency: A Different Kind of Size Problem
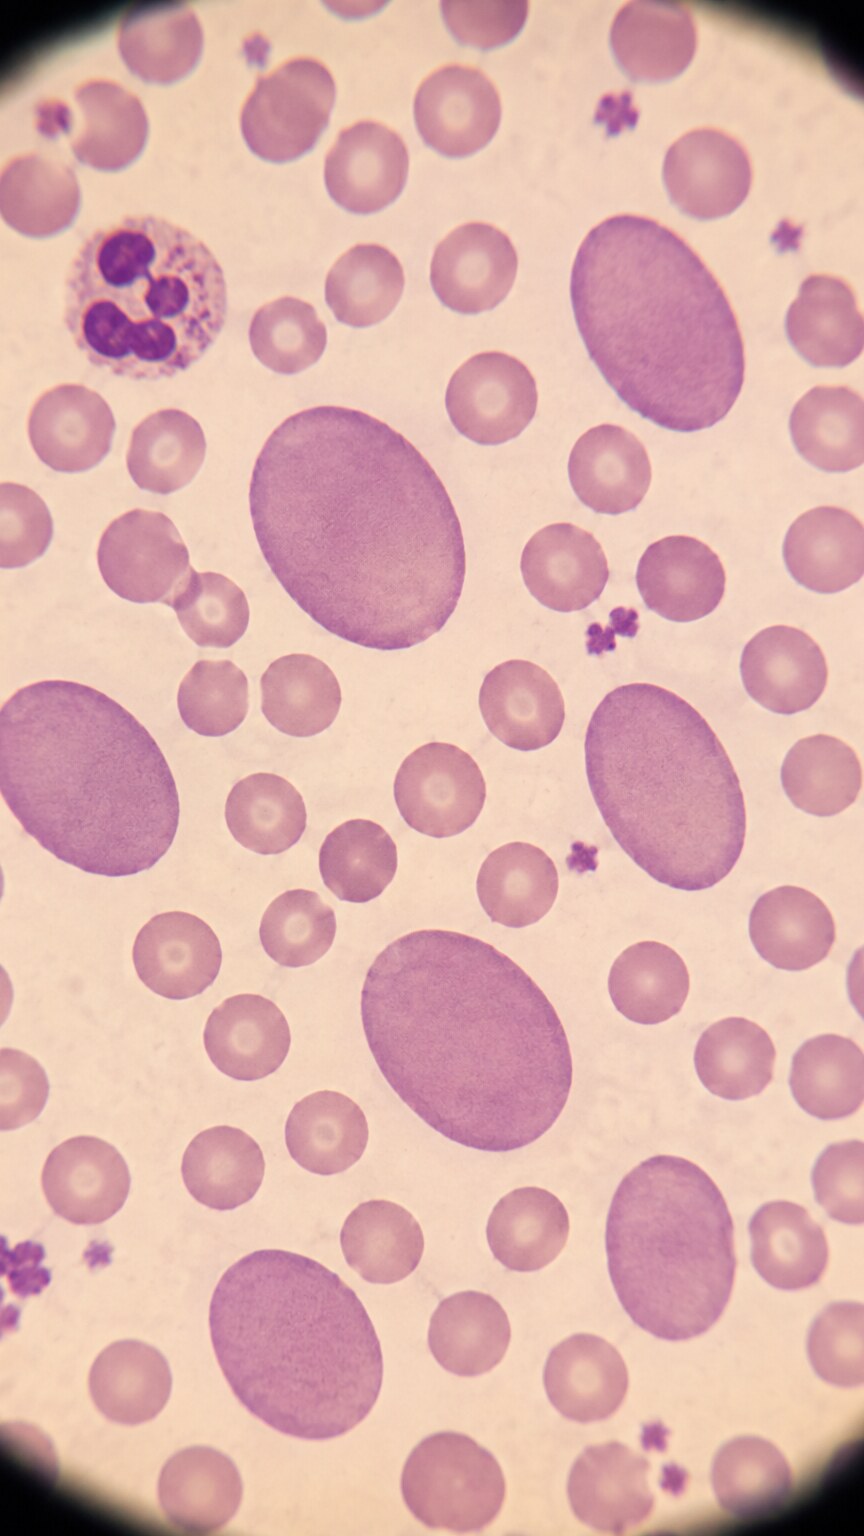
A deficiency in vitamin B12 or folate produces elevated RDW through a related but mechanistically distinct route. Both nutrients are essential for DNA synthesis inside developing red blood cells in the bone marrow, and without enough of either, those cells struggle to divide normally while continuing to grow — the result is megaloblastic anemia, where red blood cells end up abnormally large, a change called macrocytosis, rather than abnormally small. As with iron deficiency, this process typically develops gradually, so a mix of these oversized, still-developing cells circulates alongside cells produced earlier, before the deficiency became significant, once again creating a genuinely wide range of sizes and elevating RDW. One detail that makes this pattern additionally distinctive on a blood smear is that many of these oversized cells aren't just larger — they're oval-shaped rather than the normal round biconcave disc, a finding pathologists specifically look for as a companion clue alongside the RDW and MCV numbers themselves.
What makes B12 and folate deficiency particularly worth catching through RDW is that the underlying cause isn't always dietary, and it isn't always obvious. Pernicious anemia, an autoimmune condition that destroys the stomach cells responsible for absorbing B12, is a common cause in older adults and has nothing to do with how much B12 someone eats. Certain medications, weight-loss surgery that alters how nutrients are absorbed, and chronic digestive conditions like celiac disease or Crohn's disease can all interfere with B12 or folate absorption even in someone eating a perfectly adequate diet. Because untreated B12 deficiency specifically can eventually cause irreversible nerve damage if left unaddressed for too long, catching this pattern through a widened RDW and elevated MCV together is one of the more clinically important reasons this particular lab combination gets investigated promptly rather than dismissed.
When Two Deficiencies Hide Each Other: The Combined Pattern
One of the more genuinely clever diagnostic uses of RDW comes into play when someone has both a size-shrinking cause and a size-growing cause happening simultaneously — iron deficiency alongside B12 or folate deficiency, for instance, which isn't as rare a combination as it might sound, particularly in people with poor overall nutrition, certain malabsorption conditions, or after significant weight-loss surgery. In this situation, MCV, the average size, can look deceptively normal, because the abnormally small iron-deficient cells and the abnormally large B12-deficient cells mathematically cancel each other out when averaged together. RDW doesn't get fooled by this the same way, because it isn't measuring the average at all — it's measuring the spread, and a population containing both very small and very large cells at once produces a dramatically widened curve regardless of what the average happens to land on. This is exactly why an elevated RDW paired with a completely normal-looking MCV is treated as a specific red flag worth investigating rather than reassuring, since it can be the only clue on a routine panel that two separate nutritional problems are happening at the same time.
A blood smear reviewed under a microscope can sometimes confirm this combined pattern even more directly than the numbers alone. Where a pure iron deficiency smear shows fairly uniformly small, pale cells, and a pure B12 deficiency smear shows uniformly large, oval cells, a combined deficiency smear can show a genuinely striking mixture of both extremes sitting side by side in the same field of view — visibly small, pale cells next to visibly large, oval ones, with comparatively few cells of truly average size in between. This kind of "double population" appearance under the microscope is often what first alerts a pathologist reviewing the smear to suspect a combined deficiency, prompting them to specifically recommend both iron studies and a B12/folate panel rather than just one or the other, even before either number has been confirmed by additional blood work.
Recent Blood Loss and Active Hemolysis
RDW doesn't only rise from nutritional shortages — it also climbs whenever the bone marrow is forced to work faster than usual to replace red blood cells that are disappearing prematurely. After a significant episode of bleeding, whether from a visible injury, heavy menstrual periods, or slow, ongoing blood loss somewhere in the digestive tract that isn't visibly obvious, the bone marrow ramps up production and releases reticulocytes, the larger, immature red blood cells mentioned earlier, into circulation ahead of schedule to help restore red blood cell numbers quickly. The same thing happens in hemolytic anemia, a group of conditions where red blood cells are being destroyed faster than normal, whether from an inherited condition, an autoimmune process attacking the cells directly, or a mechanical cause like a faulty heart valve physically shearing cells apart as blood passes through it. In both situations, this surge of larger reticulocytes mixing with the existing, normally sized red blood cell population widens the distribution curve and raises RDW, making it a useful early indicator that the bone marrow has shifted into active, compensatory overdrive — often before hemoglobin itself has dropped enough to be clearly abnormal.
What a High RDW Can Reveal Even Before an Analyzer Report
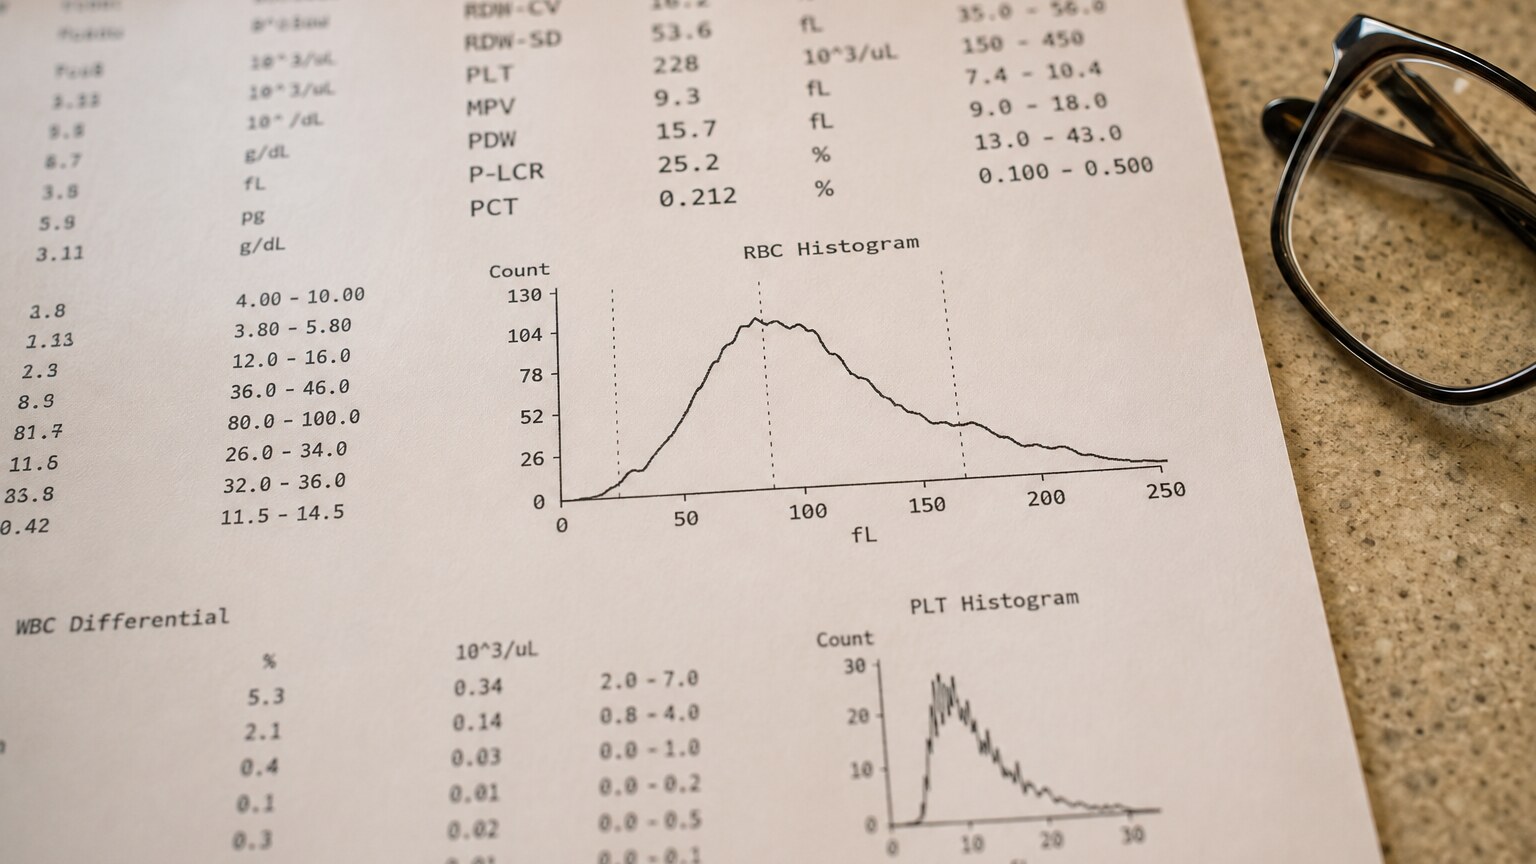
The physical histogram curve the analyzer generates internally, even though most patients never see it directly on their printed report, is worth picturing to really understand what a lab technologist or pathologist is interpreting behind the scenes. A healthy person's curve looks like a tall, narrow, single peak — nearly all their red blood cells clustered tightly around one size. Iron deficiency tends to produce a curve that's shifted noticeably to the left, toward smaller volumes, and stretched wider than normal. B12 or folate deficiency shifts the curve to the right, toward larger volumes, with a similarly widened spread. A combined deficiency, or active bleeding mixing reticulocytes into an otherwise normal population, can even produce a curve with two distinct humps rather than one smooth peak — a visual pattern pathologists specifically recognize as a strong clue that two separate red blood cell populations are circulating at once, well before any of the underlying causes have been formally worked up.
Chronic Disease, Liver Disease, and Other Broader Causes
Beyond the nutritional and blood-loss causes covered so far, several chronic conditions raise RDW through less direct but still meaningful mechanisms. Chronic kidney disease, ongoing inflammatory conditions like rheumatoid arthritis or inflammatory bowel disease, and certain chronic infections can all subtly disrupt normal red blood cell production and maturation in the bone marrow, producing a mildly widened size distribution even without a clear-cut nutritional deficiency behind it. Liver disease and heavy alcohol use can independently affect red blood cell membrane structure in ways that alter cell size and shape, contributing to a widened RDW alongside other lipid and enzyme changes typical of liver dysfunction. Certain bone marrow disorders, including myelodysplastic syndromes, in which the bone marrow itself produces abnormal, poorly regulated cells, can cause a markedly elevated RDW as one of the earliest detectable clues, which is part of why a persistently high RDW without any obvious nutritional or bleeding explanation sometimes prompts a more thorough hematologic workup rather than being assumed to be benign.
Why Hospitals Also Use RDW as a General Marker of Illness Severity
Beyond its role in sorting out anemia, RDW has picked up a somewhat unexpected second life in hospital medicine over the past couple of decades: research has repeatedly found that an elevated RDW is associated with worse outcomes across a surprisingly wide range of unrelated illnesses, including heart failure, sepsis, and various causes of hospitalization, independent of whether the person is even anemic at all. The exact reason for this broader association isn't fully settled, but the leading explanation ties back to the same underlying biology discussed throughout this article: RDW appears to reflect how much systemic stress, inflammation, and metabolic disruption the bone marrow is being exposed to, since inflammation is known to interfere with normal iron handling and red blood cell maturation even without a true nutritional deficiency present. This is why some hospital risk-scoring tools now incorporate RDW as one input among several, not because a clinician necessarily believes it's causing the illness itself, but because it's turned out to be a genuinely useful, already-available signal of how much physiological strain a person's body is currently under.

What Symptoms, if Any, Actually Show Up
RDW itself doesn't cause symptoms — it's a measurement, not a disease — but the underlying conditions that raise it very often do, and recognizing those signs is part of why a doctor takes an elevated RDW seriously rather than treating it as a lab curiosity. Iron deficiency severe enough to affect RDW frequently comes with fatigue, unusual paleness, and in more advanced or long-standing cases, changes to the nails themselves — they can become brittle, unusually pale, or in a distinctive but less common presentation called koilonychia, take on a concave, spoon-like shape rather than their normal curve. B12 deficiency can produce its own distinct symptom set, including numbness or tingling in the hands and feet, balance problems, and in some cases, memory or concentration difficulties, reflecting B12's essential role in maintaining healthy nerve function beyond just red blood cell production. Recognizing these physical signs alongside a lab result helps a doctor gauge how long an underlying deficiency has likely been present and how urgently it needs to be addressed, rather than relying on the RDW number in isolation.
Some people with a mildly elevated RDW, particularly one caught incidentally on routine bloodwork, have no symptoms at all, which is worth stating plainly rather than glossing over. Early or mild nutritional deficiencies, and low-grade chronic inflammation, can widen the size distribution curve well before it produces anything a person would actually notice day to day. This is exactly why RDW earns its reputation as a useful early-detection tool rather than just a confirmatory one — by the time symptoms like fatigue or pallor become noticeable enough for someone to mention them to a doctor, the underlying process has often already been progressing quietly for weeks or months, and an elevated RDW on an otherwise routine panel can be the first tangible evidence that something is worth investigating further.
How Doctors Actually Use RDW Alongside MCV
RDW is rarely interpreted alone — its real diagnostic power comes from being read together with MCV, since the combination of "how big" and "how varied" narrows the list of likely causes far more precisely than either number could alone. Small cells with a normal RDW often point toward thalassemia trait, an inherited condition where cells are uniformly small rather than variably sized, since the genetic cause affects every cell equally from the start. Small cells with a high RDW points more strongly toward iron deficiency, reflecting that mixed population of older and newer cells described earlier. Large cells with a high RDW suggests B12 or folate deficiency. Large cells with a normal RDW can suggest other causes of macrocytosis that don't involve this kind of gradual size drift, such as certain medication effects or liver disease acting through a more uniform mechanism. This four-way framework is exactly the kind of pattern-based reasoning a doctor or lab reviewing your results applies almost automatically, which is part of why a single number rarely gets interpreted in isolation on a real report.

What happens after an elevated RDW is found depends entirely on identifying which of these categories fits. If iron deficiency is confirmed through additional testing, like ferritin, treatment usually starts with dietary changes and oral iron supplementation, with a repeat blood count some weeks later to confirm both the RDW and MCV are trending back toward normal as the size mismatch resolves. If B12 or folate deficiency is confirmed, treatment involves replacing whichever nutrient is low, sometimes through injections rather than oral supplements if an absorption problem is identified as the root cause. If the pattern instead points toward active bleeding or hemolysis, the investigation shifts toward finding and addressing the source directly, since supplementation alone won't resolve a problem rooted in ongoing cell loss rather than a manufacturing shortage. In every case, RDW itself isn't the target of treatment — it's the clue that tells a doctor which underlying process to actually go after.
Timelines for improvement vary meaningfully depending on which cause is behind the elevation, and knowing roughly what to expect helps set realistic expectations for anyone tracking their own follow-up labs. Iron deficiency corrected through supplementation typically shows early improvement in reticulocyte counts within about a week, with RDW and MCV gradually normalizing over the following one to two months as the mixed population of old, small cells gets fully replaced by consistently sized new ones. B12 deficiency often resolves the underlying megaloblastic changes a bit faster once replacement begins, though full normalization of RDW can still take several weeks. Causes tied to active bleeding or hemolysis normalize on their own timeline entirely dependent on when the underlying source is controlled, which is why a repeat CBC is such a standard, low-effort way to confirm that whatever treatment was started is actually working as intended, rather than simply assuming it based on symptoms alone.
Two Ways RDW Is Actually Reported
Not every lab report presents RDW the same way, and knowing which version you're looking at matters when comparing a result against a reference range. RDW-CV, the more commonly reported version, expresses the spread as a coefficient of variation — essentially a percentage describing how much cell sizes deviate relative to the average size itself. A less commonly reported alternative, RDW-SD, measures the actual width of the size distribution curve in femtoliters, an absolute unit of volume, rather than as a percentage relative to the average. The practical difference matters most in one specific situation: because RDW-CV is calculated relative to MCV, a person with an unusually large or small average cell size can show a modestly abnormal RDW-CV even with a genuinely normal-looking distribution curve, simply due to how the math interacts with an already-shifted average. RDW-SD doesn't have that quirk, since it measures the actual spread directly rather than relative to the mean, which is why some hematologists prefer it in cases where MCV itself is already significantly abnormal and could otherwise distort the more commonly used RDW-CV value.
What a Normal Range Actually Looks Like
Most laboratories report a normal RDW-CV range somewhere between about 11.5% and 14.5%, though the exact cutoffs can vary slightly from one lab and one analyzer manufacturer to the next, which is part of why it's always worth checking the specific reference range printed on your own report rather than a number pulled from a general source. Values creeping just above that upper limit, particularly in someone with no symptoms and otherwise unremarkable results elsewhere on the panel, are often followed with simple repeat testing in a few months rather than an immediate, extensive workup. Markedly elevated values, particularly above roughly 16% to 17%, or any elevation paired with clearly abnormal hemoglobin, MCV, or symptoms, moves the conversation toward more active investigation. As with most lab values, the size of the abnormality and the surrounding clinical picture both shape how urgently a result gets pursued — a mildly elevated RDW found incidentally is a very different situation than a markedly elevated one in someone who's also fatigued, pale, and reporting unusual bleeding.
Frequently Asked Questions
What's the difference between RDW and MCV?
MCV measures the average size of your red blood cells, while RDW measures how much that size varies from cell to cell. A person can have a normal MCV but a high RDW if they have a mix of both unusually small and unusually large cells that average out to a normal-looking number.
Can RDW be high without any anemia present?
Yes. RDW can rise before hemoglobin or hematocrit drop low enough to be classified as anemia, making it one of the earlier detectable signs of an emerging iron or vitamin deficiency, active blood loss, or a chronic inflammatory condition.
Why would a doctor be more concerned about high RDW with a normal MCV than with an abnormal one?
Because a normal MCV alongside a high RDW can mean two opposing size problems, like iron deficiency and B12 deficiency, are happening at once and canceling each other out in the average. It's a specific pattern that prompts investigation for more than one underlying cause.
Is a high RDW always related to blood cell production?
Not exclusively. Research has linked elevated RDW to worse outcomes across various illnesses like heart failure and sepsis, independent of anemia, likely because it reflects broader inflammatory and metabolic stress on the bone marrow rather than a red blood cell problem alone.
How is a high RDW typically treated?
RDW itself isn't treated directly — treatment targets whatever underlying cause is identified, such as iron or vitamin supplementation for a nutritional deficiency, or further investigation and treatment of an active bleeding or hemolytic process if that's the driver.
Conclusion
RDW answers a question most lab values don't even ask: not how much, but how consistent. That single shift in perspective is what makes it so useful, because size variation only shows up when something has genuinely interrupted the bone marrow's normally steady production — a gradual nutritional shortage, a sudden demand for replacement cells, or ongoing systemic stress from illness elsewhere in the body. Paired with MCV, it turns a routine blood count into a surprisingly specific diagnostic tool, capable of catching an emerging deficiency, revealing a hidden second problem, or flagging active blood loss well before other numbers would raise the alarm on their own. An elevated RDW is rarely the end of the story on a lab report — it's usually the detail that tells a doctor exactly where to look next.
Still Not Sure What Your Results Mean?
Upload your labs and get a complete, visual, plain-language interpretation of every biomarker — delivered to your inbox in under 15 minutes.
Get My ReportThis article is for educational purposes only and does not constitute medical advice. Always consult your healthcare provider regarding your specific lab results.