
Why Is My A/G Ratio Abnormal?
The A/G ratio (albumin-to-globulin ratio) isn't a single substance your body makes — it's a comparison your lab calculates between two very different protein groups floating in your blood: albumin, a single protein made only by your liver, and globulin, a catch-all name for a whole family of other proteins, including the antibodies your immune system builds. Most labs consider a ratio somewhere between roughly 1.1 and 2.5 to be typical, meaning you normally carry noticeably more albumin than globulin. When that number drifts outside that window, it's rarely because one mysterious problem has appeared — it's because the balance between two entirely separate biological systems, your liver and your immune system, has shifted relative to each other. A low ratio usually means albumin has fallen, globulin has risen, or both. A high ratio, which is far less common, usually means the opposite: globulin has dropped while albumin has stayed normal or even risen. Understanding which side of that seesaw moved, and why, is the real key to making sense of your result.

Figure 1. Serum protein electrophoresis physically separates albumin from the alpha, beta, and gamma globulin fractions, the technique used to confirm an abnormal A/G ratio.
What Albumin and Globulin Actually Are
It helps to stop thinking of "protein" in your blood as one thing, because it's really two completely different workforces sharing the same commute route through your bloodstream. Albumin is a single, specific protein — one molecule, one job description, made exclusively by your liver. Its main role is to act like a sponge that holds water inside your blood vessels; without enough of it, fluid leaks out of your circulation and pools in your tissues, which is part of why severe albumin deficiency can cause swelling in the legs or abdomen. Albumin also works as a delivery truck, ferrying hormones, medications, calcium, and fatty acids through your bloodstream attached to its surface, since many of these substances can't travel through watery blood plasma on their own.
Globulin, by contrast, isn't one protein at all — it's an umbrella term covering dozens of different proteins that happen to behave similarly when separated in a lab, the way "furniture" covers chairs, tables, and shelves without those objects having much else in common. Some globulins, called alpha and beta globulins, are made by the liver alongside albumin and handle jobs like transporting iron, cholesterol, and copper, or helping blood clot. The gamma globulins are a different story entirely — these are your antibodies, built not by the liver but by plasma cells, a specialized type of white blood cell that develops from B lymphocytes as part of your immune system. So when your lab report lists a single "globulin" number, it's actually reporting the combined total of a liver-made group and an immune-made group added together, which is exactly why an abnormal A/G ratio can point toward either a liver problem or an immune problem, depending on which side of that combined number actually moved.
Why the Ratio Leans Toward Albumin in the First Place
A healthy A/G ratio sits above 1.0, meaning albumin normally outweighs globulin, and that's not an arbitrary design choice — it reflects how much of each protein your body actually needs circulating at any given moment. Albumin is produced continuously and in large volume because its fluid-holding job never really stops; your liver churns out somewhere around 10 to 15 grams of it every single day just to keep pace with normal breakdown and loss. Globulin production, by comparison, is more need-based. Your immune system doesn't manufacture antibodies at a flat, constant rate the way your liver manufactures albumin — it ramps specific antibody production up sharply only when it recognizes a threat worth responding to, and otherwise keeps baseline output comparatively modest. That built-in asymmetry, a steady, high-volume producer versus a responsive, threat-driven one, is why the two proteins aren't expected to sit in equal amounts, and why a ratio that drifts toward 1.0 or below is treated as a signal that the usual balance of power between those two systems has shifted.
How Doctors Actually Calculate This Number
Nobody measures globulin directly in a routine blood panel — it's derived, not measured. Your lab first runs a total protein test, which uses a chemical reaction (copper ions binding to the connective bonds in your proteins to form a colored compound) to estimate the combined weight of every protein in your blood serum, typically landing somewhere between about 6.0 and 8.3 grams per deciliter in a healthy adult. Separately, your albumin is measured with a dye that binds specifically to albumin molecules and changes color in proportion to how much is present, usually falling between roughly 3.5 and 5.0 grams per deciliter. Your globulin value is then simple subtraction: total protein minus albumin. Finally, the A/G ratio itself is just albumin divided by globulin — a single number meant to summarize, at a glance, whether your liver-made and immune-made protein systems are sitting in their usual proportion to each other.
When a result looks genuinely abnormal, rather than just borderline, doctors often escalate to serum protein electrophoresis, the technique shown above. In this test, your blood proteins are placed on a gel and exposed to an electrical current, which pulls each protein through the gel at a different speed depending on its size and electrical charge. Albumin, being a single uniform protein, forms one tall, clean spike. Globulin spreads out into several smaller humps — alpha-1, alpha-2, beta, and gamma — because it's actually several different protein families lumped into one lab value. This is often the step that turns a vague "abnormal ratio" into an actual answer, because the shape of the globulin humps tells a very different story depending on whether they're broadly elevated across the board or concentrated into one unusually sharp spike.
A Number With a Surprisingly Long History
The idea of comparing these two protein groups isn't a recent invention. Chemists in the late 1800s noticed that if you exposed blood serum to different concentrations of salt, some proteins would clump together and fall out of solution while others stayed dissolved — a crude but workable way to sort proteins into two rough camps long before anyone understood their individual biological roles. That salt-based separation method stayed in use, with variable accuracy between different laboratories, for decades. Everything changed in the 1930s, when a Swedish chemist figured out how to pull proteins through a gel using an electrical current, sorting them cleanly by size and charge instead of by rough chemical behavior. That technique, electrophoresis, is essentially the same method still used today to break the globulin number down into its individual subfractions, and it's a large part of why a modern A/G ratio, and the electrophoresis pattern behind it, can be trusted as a genuinely precise clinical measurement rather than a rough historical approximation.
Already have an A/G ratio number back from a recent panel, but not sure whether it's actually something to worry about? Just plug it in and see instantly.
🧮 Try the Free CalculatorWhen the Ratio Is Low: Your Liver Is the First Place to Look

Figure 2. Hepatocytes in the liver are the body's only source of albumin, synthesizing and releasing it directly into the bloodstream.
A low A/G ratio is by far the more common abnormal finding, and the single biggest reason is that your liver has stopped keeping up with its albumin-manufacturing quota. Because albumin has exactly one source in the entire body — the hepatocytes, the main working cells of your liver — any condition that damages enough of those cells, or scars enough liver tissue, shows up as a falling albumin level almost immediately. Meanwhile, your globulin side of the equation often does the opposite: it climbs, because your immune system frequently ramps up antibody production in response to whatever is damaging your liver in the first place, whether that's a virus, alcohol, or an autoimmune attack. The result is a ratio getting pulled down from both directions at once — the numerator shrinking while the denominator grows — which is exactly why a low A/G ratio is one of the more reliable early clues that something is going on with your liver, sometimes even before other liver tests turn abnormal.
This doesn't mean every low ratio equals liver disease, but it does mean liver function deserves a first look, usually alongside tests like ALT, AST, and bilirubin, which measure liver cell injury and bile handling rather than protein output. Albumin and globulin measure something those other tests don't: your liver's actual manufacturing capacity, not just whether its cells are currently inflamed.
It's also worth noting that the liver isn't the only place a low albumin level can start. Because albumin production depends on a steady supply of dietary protein as raw material, prolonged inadequate nutrition — whether from a restrictive diet, an eating disorder, a chronic illness that suppresses appetite, or simply reduced food intake in frail older adults — can lower albumin output even in someone whose liver is otherwise completely healthy. This tends to develop more slowly than the drop seen with active liver disease, since a well-functioning liver can compensate for a while by prioritizing albumin synthesis over other, less essential proteins, but sustained deficits eventually catch up. Because malnutrition-driven low albumin and liver-driven low albumin can look identical on a basic panel, a low A/G ratio in someone with significant weight loss or a history of poor nutritional intake is one of the situations where a doctor may weigh diet and overall health status just as heavily as liver-specific causes before deciding what to investigate next.
Why Cirrhosis Is the Classic Cause of a Low Ratio
Cirrhosis is the textbook example of a low A/G ratio, and understanding why makes the whole mechanism click into place. Cirrhosis is the end stage of long-term liver injury — from causes like chronic hepatitis B or C, long-term heavy alcohol use, or fatty liver disease — in which healthy, functioning liver tissue is gradually replaced by bands of fibrous scar tissue. Scar tissue doesn't manufacture proteins. So as more of a cirrhotic liver becomes scar rather than working hepatocytes, its total albumin output declines in a way that tracks fairly closely with how advanced the scarring has become, which is part of why doctors use albumin level as one ingredient in scoring systems that estimate how severe someone's cirrhosis is.
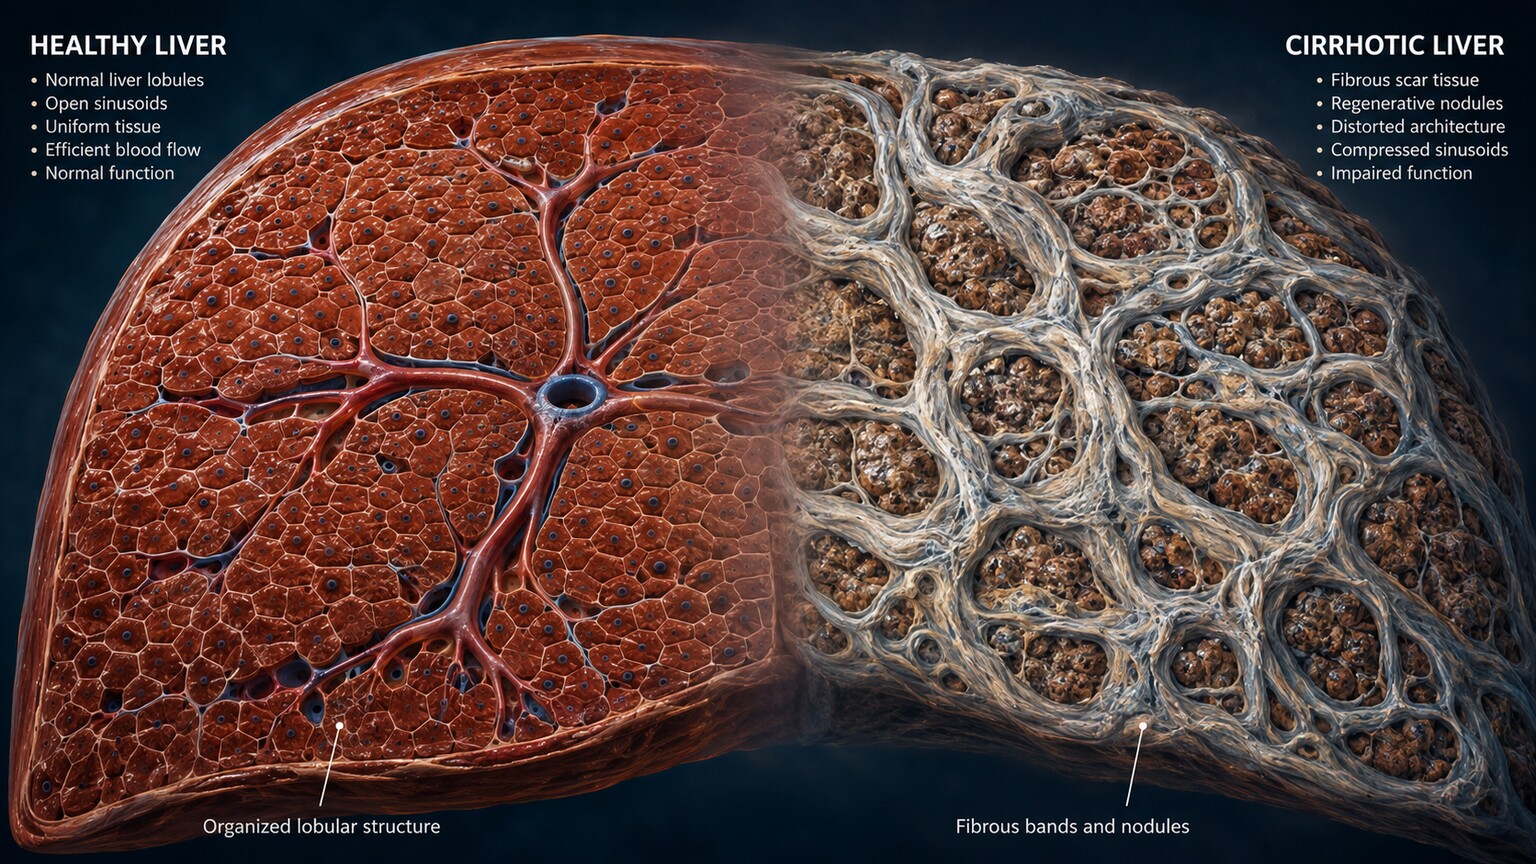
Figure 3. Cirrhosis replaces functioning liver tissue with fibrotic scar nodules, reducing the organ's capacity to synthesize albumin.
At the same time, cirrhosis pushes globulin the other way. As liver injury progresses, the immune system in the gut and spleen becomes more active, partly because a scarred, poorly circulating liver is less effective at filtering bacteria and bacterial byproducts out of the blood before they reach the rest of the body. That extra immune stimulation translates into more antibody, meaning more gamma globulin, production. Combine falling albumin with rising globulin and the A/G ratio doesn't just dip — in advanced cirrhosis, it can drop low enough that globulin actually outweighs albumin entirely, flipping what should be a comfortably albumin-dominant ratio upside down. That specific pattern — a ratio at or below 1.0 alongside other signs of liver strain — is one of the more concerning combinations a clinician can see on a routine metabolic panel.
Why Low Albumin From Cirrhosis Also Causes Visible Swelling
The falling albumin side of this equation doesn't just show up as a number — in more advanced cirrhosis, it often becomes something a person can see and feel. Remember that albumin's core job is holding water inside the blood vessels, acting like a sponge that keeps fluid from leaking out into surrounding tissue. When albumin production drops enough, that sponge effect weakens, and fluid starts seeping out of circulation into the abdominal cavity, a condition called ascites, or pooling in the lower legs and ankles as peripheral edema. This is compounded in cirrhosis by a second mechanism: scarred liver tissue physically obstructs normal blood flow through the organ, raising pressure in the portal vein system (called portal hypertension) and pushing even more fluid out of the vessels and into the abdomen. Low albumin and portal hypertension often arrive together in advanced cirrhosis, which is why ascites is considered one of the hallmark signs that liver disease has progressed to a more serious stage, and why an unexplained low A/G ratio in someone with new abdominal swelling is taken especially seriously.
When the Immune System Pushes Globulin Up on Its Own
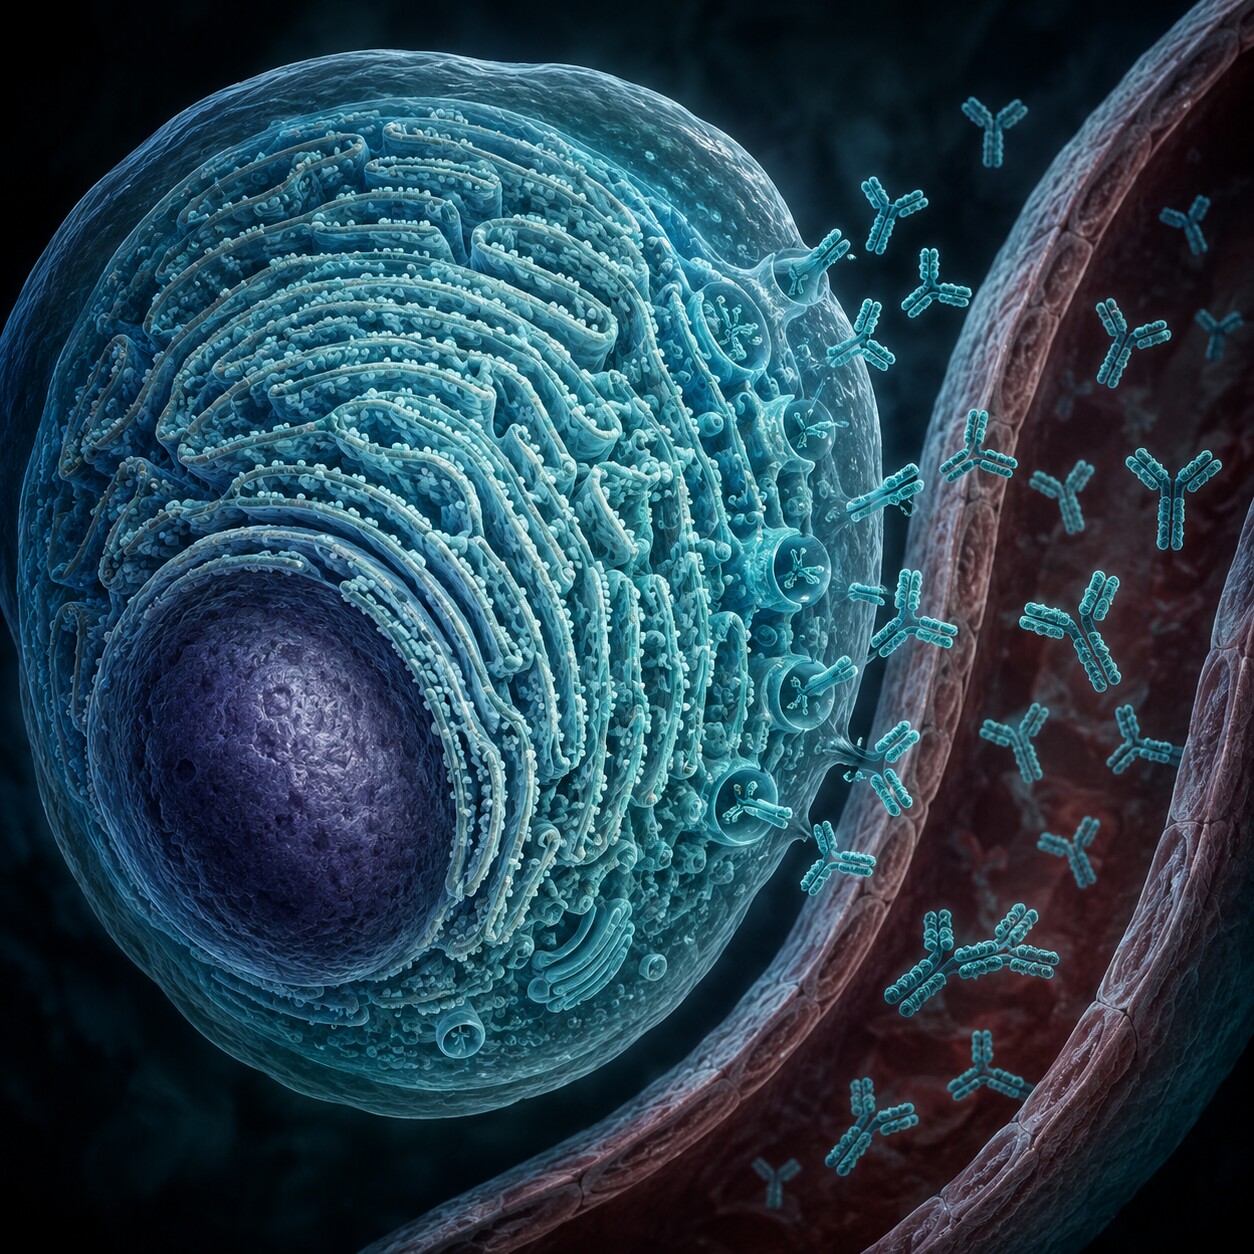
Figure 4. Plasma cells, derived from B lymphocytes, produce the immunoglobulins that make up the gamma globulin fraction measured in this ratio.
Your liver isn't always the culprit behind a low ratio. Sometimes the liver is working completely normally and albumin stays right where it should be, but globulin climbs high enough on its own to drag the ratio down regardless. This happens whenever your plasma cells go into sustained overdrive producing antibodies, which occurs with chronic infections your body can't fully clear, and with autoimmune diseases like lupus or rheumatoid arthritis, where the immune system produces large volumes of antibodies directed, at least in part, against your own tissues rather than an outside invader.
Chronic infections that commonly do this include long-standing viral hepatitis and HIV, both of which keep the immune system persistently activated for years, generating a steady, broad increase across several globulin subfractions rather than one sharp spike. On electrophoresis, this typically looks like a wide, elevated gamma region rather than a narrow peak — doctors call this a "polyclonal" pattern, meaning many different immune cell lines are each contributing a little extra antibody, as opposed to one single cell line producing an enormous amount on its own. That distinction between a broad polyclonal rise and a narrow monoclonal spike matters enormously for figuring out what's actually going on, which is exactly the distinction electrophoresis was designed to catch.
Nephrotic Syndrome: When the Kidneys, Not the Liver, Are Losing the Protein

Figure 5. Nephrotic syndrome allows albumin to pass through damaged glomeruli into the urine, often producing visibly foamy urine.
There's a third major cause of a low A/G ratio that has nothing to do with how much albumin your liver makes, and everything to do with how much of it your kidneys let escape. Your kidneys' filtering units, called glomeruli, normally act like a fine mesh strainer that lets water and small waste products through into urine while holding onto larger proteins like albumin and keeping them circulating in your blood. Nephrotic syndrome describes a group of kidney conditions — including diabetic kidney disease, certain autoimmune disorders, and specific glomerular diseases — in which that mesh becomes damaged and abnormally leaky. Because albumin is physically smaller than most globulins, it slips through the damaged filter far more easily, meaning the kidneys end up losing disproportionately more albumin than globulin into the urine.
The result is a low A/G ratio driven almost entirely by albumin loss rather than globulin excess, and it often comes with a genuinely noticeable clue outside the lab: because albumin lowers the surface tension of liquid, urine that's carrying a significant amount of lost protein can appear persistently foamy or bubbly in the toilet bowl, well beyond the temporary foam anyone might see after a fast, forceful stream. Combined with swelling around the eyes, ankles, or abdomen — another consequence of albumin no longer holding fluid inside the bloodstream where it belongs — this pattern is one of the more visible ways an internal lab abnormality can announce itself through something a person actually notices at home.
What Actually Damages the Kidney's Filter
Nephrotic syndrome isn't one single disease — it's the shared endpoint of several different conditions that all end up damaging the same filtering structure. In adults, one of the most common underlying causes is long-standing diabetes, where years of elevated blood sugar gradually thickens and stiffens the tiny blood vessels inside each glomerulus, a condition called diabetic nephropathy. Other cases stem from focal segmental glomerulosclerosis, in which patches of scar tissue form directly within the filtering structure, or from membranous nephropathy, where the immune system deposits antibody complexes along the filter membrane itself and thickens it from within. Regardless of the specific cause, the shared mechanical result is the same: a filter that used to hold albumin back now lets a meaningful amount of it through, which is why doctors investigating a low A/G ratio with suspected kidney involvement usually order a urine protein test alongside blood work, since measuring how much albumin is actually showing up in the urine is what confirms the kidneys, rather than the liver or immune system, are the real source of the problem.
Monoclonal Gammopathies: A Different Kind of Globulin Spike
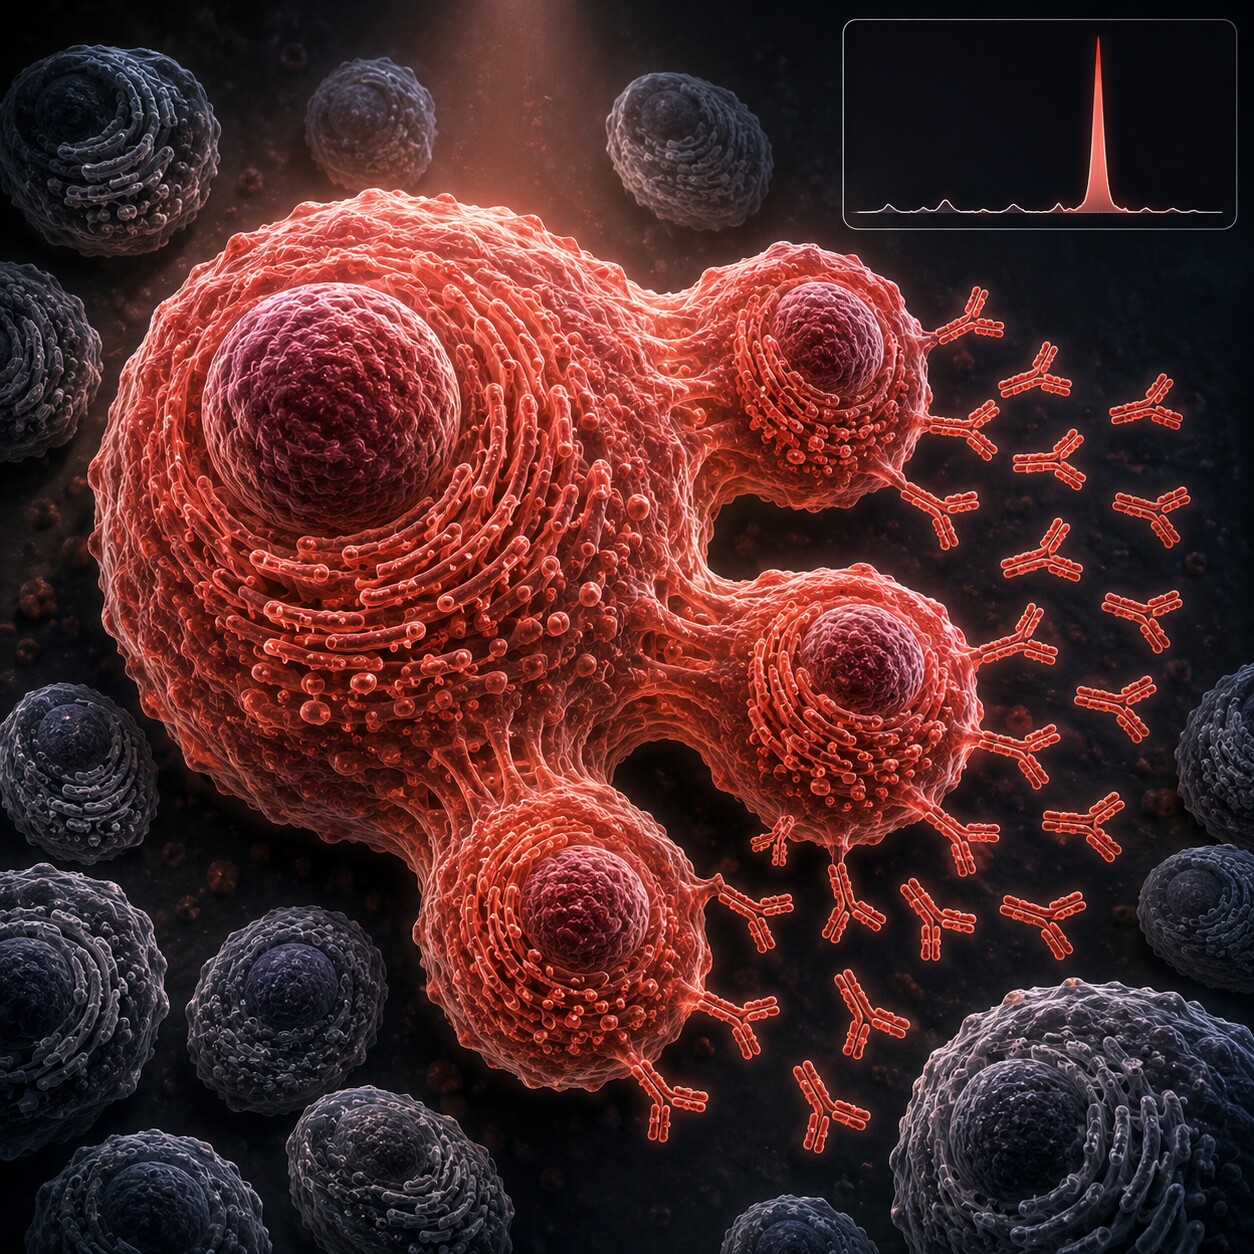
Figure 6. In monoclonal gammopathy, a single plasma cell clone overproduces one identical immunoglobulin, appearing as a sharp M-spike on electrophoresis.
Not every rise in globulin comes from a broad, healthy immune response working overtime. Occasionally, a single plasma cell — instead of the thousands of different plasma cell lines your body normally uses to make thousands of different antibodies against thousands of different threats — begins copying itself uncontrollably, and every copy churns out the exact same identical antibody. Because this is one clone doing all the work, rather than a diverse crowd, electrophoresis shows it as a single narrow, tall spike sitting on top of the gamma region rather than the broad hump seen with chronic infection or autoimmune disease. Clinicians call this pattern a monoclonal gammopathy, and the single spike itself is often nicknamed an "M-spike," short for monoclonal.
Most of the time, especially when it's found incidentally on a routine panel in someone who otherwise feels completely well, this represents a condition called MGUS — monoclonal gammopathy of undetermined significance — which is common in older adults, generally harmless on its own, and simply monitored over time rather than treated. In a smaller number of cases, especially when the spike is large or accompanied by other findings like anemia, bone pain, or kidney impairment, it can represent multiple myeloma, a cancer of plasma cells that becomes meaningfully more common with age. This is precisely why an unexplained low A/G ratio discovered later in life is taken seriously enough to warrant electrophoresis rather than being dismissed as an odd number on a routine panel — the shape of the spike, not just the ratio itself, is what tells the two possibilities apart.
Telling MGUS and Multiple Myeloma Apart
The distinction between these two possibilities comes down to how much the clonal plasma cells have actually taken over, not just whether a spike exists at all. MGUS is defined by a relatively small M-spike, a low percentage of abnormal plasma cells found if a bone marrow sample is examined, and, critically, no evidence of the organ damage multiple myeloma causes — no anemia from crowded-out normal blood cell production, no elevated calcium from bone breakdown, no kidney impairment from abnormal protein deposits, and no visible bone lesions on imaging. Multiple myeloma crosses those same thresholds in the more severe direction, with a larger clonal population actively causing measurable harm elsewhere in the body. Because MGUS carries a small but real lifetime chance of eventually progressing into myeloma — commonly cited at around 1% per year — the usual approach isn't to ignore an incidental spike but to recheck labs periodically, watching for any of the specific danger signs that would suggest the more serious diagnosis is developing rather than staying dormant.
What a High A/G Ratio Can Mean
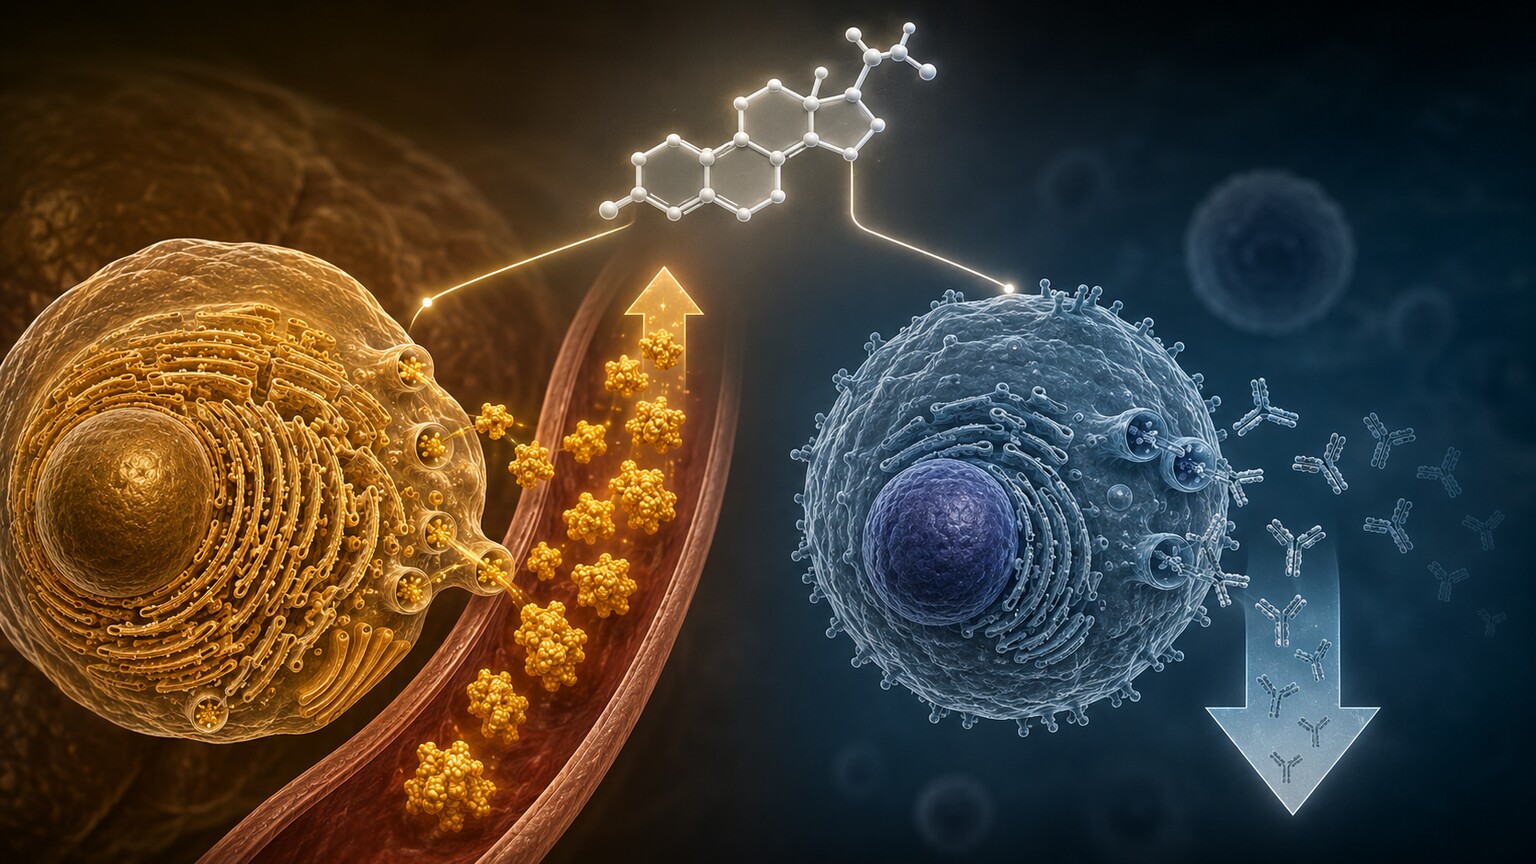
Figure 7. Corticosteroids can raise the A/G ratio by simultaneously boosting hepatic albumin synthesis and suppressing globulin-producing lymphocytes.
A high A/G ratio is a much rarer finding than a low one, and it almost always points toward the globulin side of the equation running low rather than albumin running unusually high. One of the more common explanations is corticosteroid use — medications like prednisone, prescribed for everything from asthma flares to autoimmune disease — which nudges the ratio upward through two mechanisms working at the same time. Corticosteroids tend to stimulate the liver's protein-making machinery, modestly boosting albumin output, while simultaneously suppressing the activity of lymphocytes, the immune cells responsible for antibody production. Albumin edges up while globulin edges down, and the ratio between them climbs in response.
Less commonly, a persistently high ratio can reflect a genuine immune deficiency, in which the body simply isn't manufacturing normal amounts of antibody. This ranges from inherited conditions present from birth, in which the immune system never developed a full antibody-producing capacity, to acquired immune suppression from certain medications or chronic illnesses later in life. Because antibodies are a core part of how the body fights infection, a high A/G ratio found alongside a pattern of frequent or unusually severe infections is a meaningful clue that prompts further immune system testing, rather than something to write off as good news simply because the number sits on the opposite side of "abnormal" from cirrhosis.
One specific inherited example is X-linked agammaglobulinemia, a rare genetic condition in which a mutation prevents B lymphocytes from maturing into functioning, antibody-producing plasma cells at all. Boys born with this condition — it's carried on the X chromosome, so it overwhelmingly affects males — typically appear healthy at birth, protected temporarily by antibodies passed from their mother during pregnancy, but begin developing repeated bacterial infections in their first year or two of life as that borrowed protection wears off and their own antibody production never picks up the slack. It's a rare condition, but it's a clean illustration of the underlying principle behind every high A/G ratio: whenever the globulin side of the ledger runs low, whether from a rare genetic glitch, a common medication, or an acquired illness, the ratio between the two protein systems tips upward in response, exactly the same seesaw mechanism running in the opposite direction from what happens in cirrhosis.
How This Number Fits Into Your Broader Panel
The A/G ratio rarely travels alone on a lab report — it's usually printed as part of a comprehensive metabolic panel or a dedicated liver function panel, sitting next to other values that, taken together, tell a much fuller story than any single number could on its own. Alanine aminotransferase (ALT) and aspartate aminotransferase (AST) are enzymes that leak out of liver cells when they're injured, so they measure active cell damage happening right now, which is a different signal than albumin and globulin, which measure the liver's ongoing manufacturing output. A person can have completely normal ALT and AST — meaning no active cell injury at this moment — while still having a low A/G ratio, because manufacturing capacity can decline gradually from long-term scarring even during a quiet period when the liver isn't actively inflamed. This is exactly why the two categories of test are read together rather than as substitutes for one another; ALT and AST answer "is something actively damaging the liver right now," while albumin, globulin, and their ratio answer "how well is the liver still able to do its job overall."
Bilirubin, another common liver panel component, adds a third dimension by measuring how well the liver is processing and excreting a waste product from old red blood cells, which is a bile-handling function rather than a manufacturing one. Kidney markers like creatinine and estimated glomerular filtration rate, meanwhile, help rule the kidneys in or out as the source of a low ratio, since — as covered above — significant albumin loss through damaged kidney filters produces a very similar low ratio to what liver disease produces, even though the underlying organ and treatment path are completely different. Seeing your A/G ratio in the context of these surrounding values, rather than as an isolated number, is usually what lets a healthcare provider narrow down which of the several possible explanations actually fits your specific situation.
Can a Single Abnormal Result Just Be Noise?
Yes, and this is worth sitting with before assuming the worst about one number on one panel. Reference ranges are built from population averages, not individual guarantees, which means a small percentage of genuinely healthy people will naturally fall just outside the typical 1.1 to 2.5 window without having any underlying disease at all — the same way height, blood pressure, or cholesterol naturally vary from person to person without every deviation representing a problem. A ratio that's mildly abnormal, isolated to a single test, unaccompanied by symptoms, and not trending in a worsening direction over repeat testing is a very different situation from a ratio that's dramatically abnormal, paired with other abnormal liver or kidney markers, or getting steadily worse across multiple visits.
This is also part of why doctors rarely interpret the A/G ratio in isolation. It's typically read alongside the individual albumin and total protein values it was calculated from, alongside liver enzymes like ALT and AST, kidney markers like creatinine, and a person's overall history and symptoms. A mildly low ratio in someone with no liver risk factors, normal liver enzymes, and no symptoms carries a very different weight than the same number in someone with a history of heavy alcohol use or chronic hepatitis. Context, repetition over time, and the company the number keeps on the rest of the panel usually matter more than the single figure on its own.
Frequently Asked Questions
Is a low A/G ratio always a sign of liver disease?
No. While liver disease, especially cirrhosis, is the classic and most common cause, a low ratio can also come from chronic infection, autoimmune disease, nephrotic syndrome, malnutrition, or a monoclonal gammopathy. Because several unrelated conditions can produce the same low number, the ratio is treated as a starting clue rather than a standalone diagnosis, and it's usually followed up with additional targeted testing.
Can diet or hydration change my A/G ratio?
Diet has a meaningful but slower effect: prolonged inadequate protein intake, seen in severe malnutrition or certain chronic illnesses, can lower albumin production over weeks, which can lower the ratio. Hydration mainly affects total protein concentration rather than the ratio itself, since dehydration or overhydration tends to concentrate or dilute both albumin and globulin roughly together rather than shifting their relative proportion to each other.
Do I need serum protein electrophoresis every time my A/G ratio is abnormal?
Not necessarily. A mildly abnormal ratio with an otherwise unremarkable panel and no symptoms is often simply rechecked after some time to see if it normalizes or persists. Electrophoresis is more commonly ordered when the ratio is significantly abnormal, doesn't correct on repeat testing, or appears alongside other findings — such as anemia, bone pain, or abnormal liver enzymes — that suggest a more specific cause worth identifying by name.
Is a high A/G ratio ever something to worry about?
It can be, though it's far less common than a low ratio. A high ratio caused by corticosteroid medication is usually expected and not concerning on its own. A high ratio in someone not taking steroids, especially alongside a history of frequent infections, is worth discussing with a doctor, since it can point toward an underlying immune deficiency affecting antibody production.
Does age change what counts as a normal A/G ratio?
The numeric reference range itself stays fairly consistent across adult age groups, generally between about 1.1 and 2.5. What does shift with age is which causes are statistically more likely behind an abnormal result — monoclonal gammopathies and cumulative liver risk factors both become meaningfully more common in older adults, so the same low number tends to prompt a broader workup later in life than it might in someone in their twenties with no other risk factors.
Can pregnancy affect the A/G ratio?
Yes, mildly. Pregnancy naturally increases blood plasma volume, which can dilute albumin somewhat, and it also involves normal immune system adjustments that can shift globulin levels. Most of these changes are modest and expected, but a markedly abnormal ratio during pregnancy, particularly alongside swelling or high blood pressure, is still worth flagging to an obstetric provider, since it can occasionally reflect a pregnancy-related kidney condition like preeclampsia.
Conclusion
The A/G ratio is really a story about two separate systems in your body — your liver's manufacturing line and your immune system's antibody factory — and how their output compares to each other at the moment your blood was drawn. A low ratio usually means the liver has slowed its albumin output, the immune system has ramped up globulin production, or both at once, with cirrhosis, chronic inflammation, autoimmune disease, kidney protein loss, and monoclonal gammopathies all capable of producing that same downward pull through very different mechanisms. A high ratio, much rarer, usually points the other way, toward suppressed or reduced globulin production, whether from medication or an underlying immune deficiency.
None of this means you need to memorize which organ system caused which pattern before your next appointment. What's actually useful to take away is simpler: this one small number on a routine panel is a summary of a much bigger, ongoing conversation happening between your liver and your immune system, and an abnormal result is best treated as an invitation to ask a more specific question, not a verdict to sit with alone. Because so many different conditions can nudge this one number in the same direction, it functions best as a signal that opens the door to a more targeted conversation with a healthcare provider — about your liver, your kidneys, or your immune system — rather than as a diagnosis you can read off a page on your own.
Still Not Sure What Your Results Mean?
Upload your labs and get a complete, visual, plain-language interpretation of every biomarker — delivered to your inbox in under 15 minutes.
Get My ReportThis article is for educational purposes only and does not constitute medical advice. Always consult your healthcare provider regarding your specific lab results.