
Why Did My Doctor Mention My Cholesterol Ratio?
If your doctor brought up your "cholesterol ratio," they weren't inventing a new number out of thin air — they were doing simple division with two numbers your lipid panel already gave you: your total cholesterol and your HDL cholesterol, the particle usually nicknamed "good cholesterol." Divide the first by the second and you get a single figure, something like 4.2 or 5.8, that doctors have used for decades as a fast way to gauge heart disease risk without making you memorize what every individual line on a lipid panel means. The reason it comes up is usually one of two things: either the number itself landed somewhere your doctor wanted to flag, or they're using it to explain why a cholesterol picture that looks "fine" at first glance — or "concerning" at first glance — actually tells a more complete story once total cholesterol and HDL are considered together instead of separately. This article walks through exactly what the ratio is, how it's calculated, what counts as healthy, why it sometimes matters more than any single cholesterol number on its own, and what genuinely moves it in a better direction.
What Is a Cholesterol Ratio, Exactly?
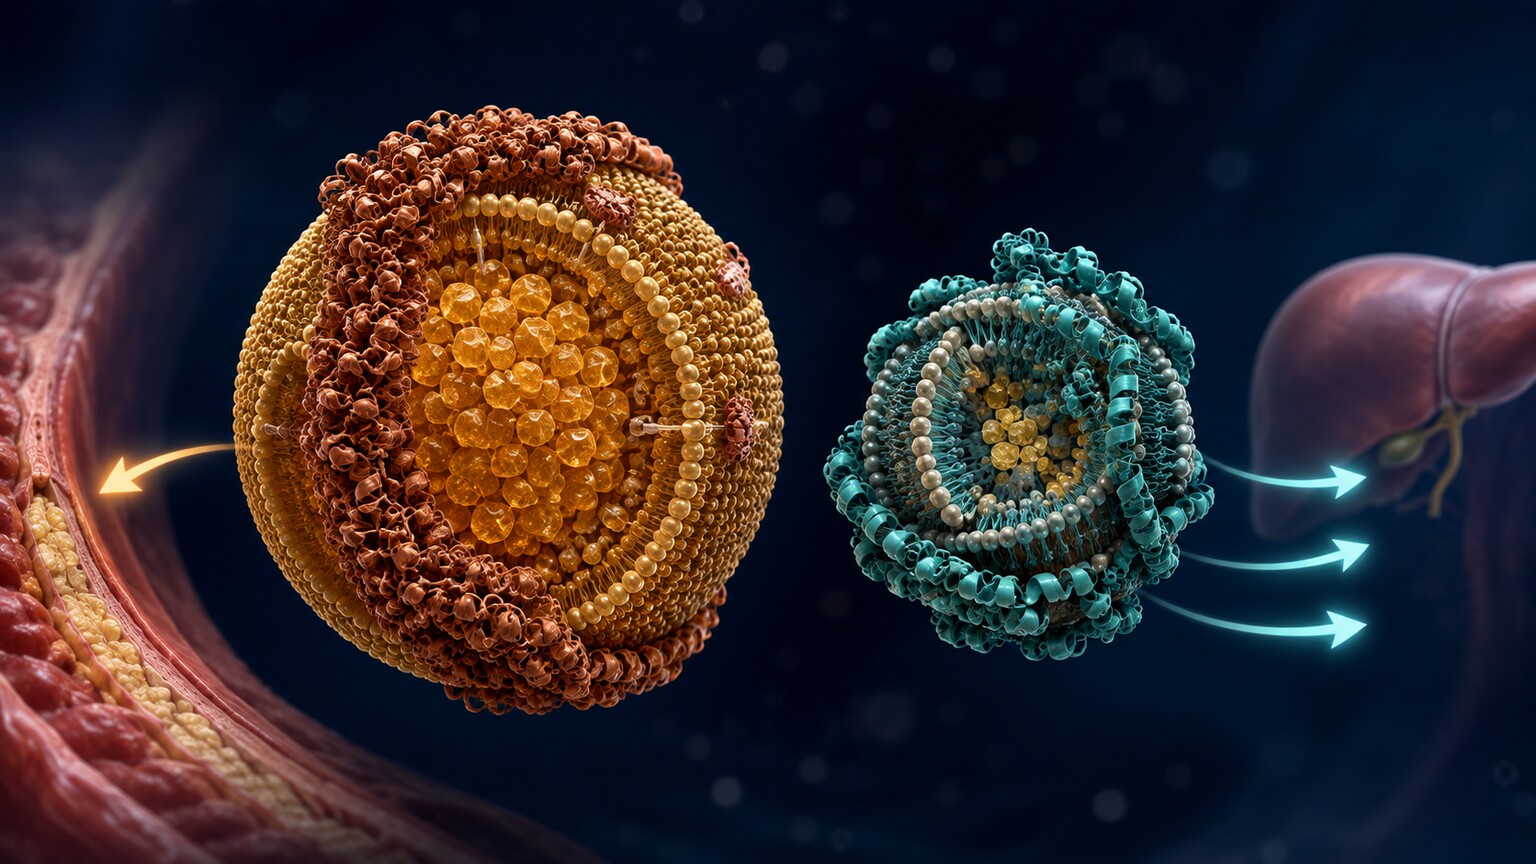
Figure 1. LDL and HDL are structurally distinct particles — one deposits cholesterol into tissue, the other collects it and carries it back to the liver — which is exactly why comparing their amounts as a ratio reveals more than either number alone.
A "cholesterol ratio" almost always refers to one of two specific calculations, and it's worth knowing which one your doctor means, because they aren't interchangeable. The first, and by far the most commonly cited, is the total cholesterol to HDL ratio (often written TC/HDL): your total cholesterol number divided by your HDL number. The second is the LDL to HDL ratio, which swaps total cholesterol for LDL — the particle most people already know as "bad cholesterol" — in the numerator. Both ratios are trying to answer the same underlying question from slightly different angles: how much cholesterol-carrying traffic is moving through your bloodstream in a form capable of contributing to artery damage, relative to how much protective, cleanup-oriented traffic is moving in the opposite direction.
To understand why this matters, it helps to know what HDL and LDL actually do, since they aren't just "good" and "bad" versions of the same molecule — cholesterol itself is a single, identical substance no matter which particle is carrying it. LDL, short for low-density lipoprotein, functions mainly as a delivery truck, carrying cholesterol out from the liver to tissues throughout the body that need it to build cell membranes and make hormones. The problem isn't that this delivery happens — it's essential — it's that LDL particles are also small enough to slip into the wall of an artery, where they can get trapped, chemically altered, and gradually built into the fatty plaques that define atherosclerosis, the process behind most heart attacks and strokes. HDL, high-density lipoprotein, works in the opposite direction: it's often described as the cleanup crew, picking up excess cholesterol from tissues and artery walls and hauling it back to the liver to be recycled or removed from the body entirely, a process called reverse cholesterol transport. A cholesterol ratio is, in essence, a snapshot of the balance between how much "delivery" traffic and how much "cleanup" traffic your blood currently has moving through it.
How the Ratio Is Actually Calculated
The math itself is genuinely simple — that's part of why the ratio has stayed popular with doctors for so long, even as more sophisticated lipid tests have become available. For the total cholesterol to HDL ratio, you take the total cholesterol result from your lipid panel and divide it by the HDL result, both measured in the same unit, milligrams per deciliter (mg/dL). If your total cholesterol is 200 mg/dL and your HDL is 50 mg/dL, your ratio is 200 divided by 50, which equals 4.0. If your HDL were lower, say 35 mg/dL, that same total cholesterol of 200 would produce a ratio of 5.7 — a meaningfully worse number, even though your total cholesterol didn't change at all. That single example is really the whole point of the ratio in one sentence: it lets a low HDL quietly worsen your risk profile even when total cholesterol looks unremarkable, and it lets a high HDL meaningfully improve your risk profile even when total cholesterol runs a bit elevated.
The LDL to HDL ratio works identically, just substituting LDL for total cholesterol in the numerator. Using an LDL of 130 mg/dL and an HDL of 50 mg/dL, the calculation is 130 divided by 50, giving a ratio of 2.6. Because LDL and total cholesterol usually move in the same general direction — LDL typically makes up somewhere around 60 to 70 percent of total cholesterol for most people — the two ratios tend to tell a broadly similar story, though not always identically, especially when triglycerides are elevated enough to shift how total cholesterol is distributed among its component particles.
Curious what your own total cholesterol, LDL, and HDL numbers add up to? Upload your results and get a complete, plain-language breakdown in under 15 minutes.
Analyze My ResultsNeither ratio is typically printed as its own line on a standard lipid panel — most labs report total cholesterol, LDL, HDL, and triglycerides as separate results and leave the division to whoever is interpreting them, whether that's a physician doing quick mental math during a visit, an electronic health record calculating it automatically in the background, or a patient doing it themselves with a calculator once they know which two numbers to use. That's often exactly why a doctor "mentions" the ratio out loud — it isn't a new test result you missed, it's an interpretation layer applied to numbers you already have.
Where This Ratio Came From
The total cholesterol to HDL ratio isn't a recent invention — its predictive value was established through the Framingham Heart Study, a landmark research project that began following the cardiovascular health of residents of Framingham, Massachusetts, starting in 1948 and continuing across multiple generations of the same families ever since. Framingham is where much of what's now considered basic cardiovascular knowledge was first proven with real, long-term data rather than assumption: that high blood pressure raises heart attack risk, that smoking is a major independent risk factor, and that HDL cholesterol behaves in the opposite direction from LDL, actively lowering risk rather than simply being a neutral bystander. Researchers analyzing decades of Framingham data found that the ratio between total cholesterol and HDL predicted future cardiovascular events more accurately than total cholesterol alone, which is precisely why it moved from a research curiosity into routine clinical use.
Part of the ratio's staying power is practical rather than purely scientific: it requires no additional blood draw, no specialized equipment, and no cost beyond a lipid panel most patients are already having done. In an era before electronic health records could run more sophisticated multi-factor risk calculators automatically, a ratio a doctor could compute with simple division was a meaningful upgrade in how much information could be extracted from an existing test. Modern cardiovascular risk tools have grown considerably more sophisticated since then, incorporating blood pressure, diabetes status, smoking history, and age into single combined risk-percentage estimates — but the ratio has remained part of that conversation because the underlying relationship it captures, between cholesterol-delivering and cholesterol-clearing particles, has held up well across decades of subsequent research.
How Age, Sex, and Menopause Change What's Typical
A cholesterol ratio doesn't mean quite the same thing for every person at every stage of life, and doctors read it with that context in mind rather than applying one identical number to everyone. Biological sex plays a significant role: estrogen has a well-documented effect of raising HDL and modestly lowering LDL, which is a major reason premenopausal women, on average, tend to run lower — meaning healthier — cholesterol ratios than men of a similar age, even when their total cholesterol numbers look comparable. This estrogen effect is a big part of why heart disease tends to show up, on average, roughly seven to ten years later in women than in men, a gap that's biological rather than simply a matter of lifestyle differences between the sexes.
That protective gap narrows and often disappears after menopause. As estrogen production declines, many women see their HDL drop and their LDL rise over a relatively short window of time, which can push a cholesterol ratio that looked comfortably healthy for years into a range that suddenly warrants more attention — frequently the exact reason a ratio comes up in a doctor's visit for a woman in her late forties or fifties who hasn't had her cholesterol flagged as a concern before. This shift is a normal, expected physiological change rather than a sign that something has gone unusually wrong, but it is one of the more clinically important reasons cardiovascular risk screening tends to intensify for women around and after the menopausal transition.
Age affects the ratio in both sexes independent of menopause specifically, since HDL's protective efficiency and the body's overall handling of fat metabolism both tend to decline gradually over the decades, nudging the average ratio upward with age even in people whose weight and diet haven't meaningfully changed. This is one of the reasons a ratio that was optimal at 30 might drift toward merely acceptable by 55 without any single dramatic lifestyle shift causing it — it's a slow accumulation that periodic lipid panels are specifically designed to catch early.
What Counts as a Good, Borderline, or High Ratio?
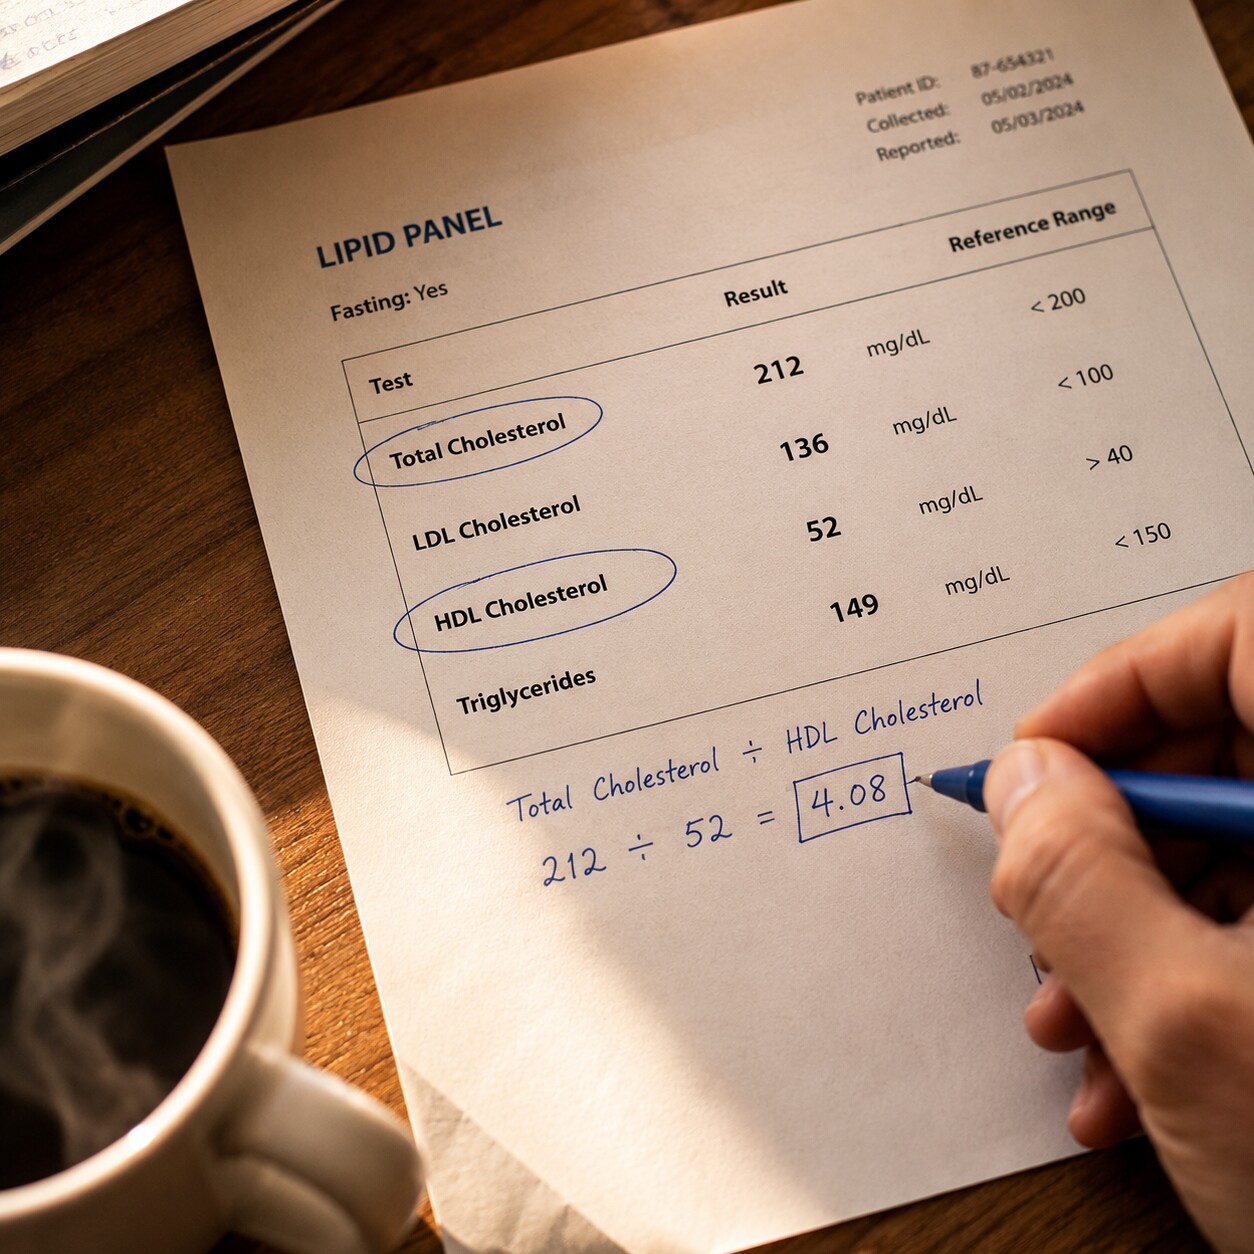
Figure 2. Dividing total cholesterol by HDL, both taken from the same lipid panel, produces the ratio a doctor is referring to when they mention it during a visit.
For the total cholesterol to HDL ratio, most major cardiology sources, including guidance referenced by the American Heart Association, frame a ratio below 5 as desirable for most adults, with a ratio under 3.5 generally considered optimal and associated with the lowest relative cardiovascular risk. A ratio of 5 is roughly the population average in the United States, which is a useful reality check — "average" is not the same as "ideal," since average cardiovascular risk in a population that eats a lot of processed food and moves less than it used to isn't a low bar. Ratios climbing toward 6, 7, or higher are associated with progressively higher cardiovascular risk, and a ratio above roughly 9 to 10 is generally considered high risk by most clinical references.
For the LDL to HDL ratio, the commonly cited optimal target is under 2.5, with a ratio between 2.5 and 3.5 considered a moderate range, and anything climbing above roughly 3.5 to 4 flagged as an elevated-risk pattern worth a closer look. As with most lab-based risk markers, these thresholds are population-level guidelines rather than hard cutoffs that guarantee an outcome — a ratio of 5.2 doesn't mean a heart attack is inevitable, and a ratio of 3.1 doesn't mean risk is zero. What the ratio does well is give a doctor a fast, single-number way to flag whether a fuller conversation about cardiovascular risk factors is warranted, alongside blood pressure, blood sugar, smoking history, family history, and the rest of the picture a lipid panel was never meant to capture alone.
It's also worth knowing that the ratio typically matters more, and gets discussed more often, for people who already have at least one other risk factor in play — a family history of early heart disease, high blood pressure, type 2 diabetes, or a personal history of smoking. For someone with an otherwise low overall risk profile, a ratio that's slightly above the optimal range usually prompts a conversation about prevention rather than urgent concern; for someone already carrying other risk factors, the same ratio might weigh more heavily into a decision about starting treatment.
It helps to see the two ratios side by side with a couple of worked examples, since the numbers alone can feel abstract until they're attached to a real scenario. Someone with a total cholesterol of 180 mg/dL and an HDL of 60 mg/dL has a total cholesterol/HDL ratio of 3.0, comfortably inside the optimal range, and if their LDL is 105 mg/dL, their LDL/HDL ratio of 1.75 tells the same reassuring story from a second angle. Compare that with someone whose total cholesterol is a similar 190 mg/dL but whose HDL is only 38 mg/dL: their ratio jumps to 5.0, squarely at the population average rather than the optimal range, purely because of how much lower their HDL is — a difference a doctor scanning total cholesterol alone, at 180 versus 190, would barely register as meaningful.
Why the Ratio Sometimes Tells a Different Story Than Any Single Number

Figure 3. Total cholesterol includes several cholesterol-carrying particles beyond LDL alone, which is part of why a ratio built on total cholesterol can catch risk that an LDL number by itself might miss.
This is usually the real reason a doctor brings the ratio up specifically, rather than just reading off your LDL and calling it a day: individual numbers on a lipid panel can look reassuring in isolation while the overall picture is less reassuring than it appears, a pattern doctors sometimes call discordance. The clearest example is someone with a completely normal, even low, LDL number who also has a low HDL — a combination that's common in people with insulin resistance, type 2 diabetes, or a diet heavy in refined carbohydrates. Read one line at a time, that lipid panel looks fine. Run the ratio, and it can land in the elevated range, because a low HDL is dragging the number up even though LDL never raised a flag on its own.
The reverse pattern happens too, and it's just as clinically useful: someone with an LDL that's a little above the usual target, but a genuinely high HDL, might have a ratio in the optimal range despite the LDL number looking mildly concerning by itself. This doesn't mean LDL stops mattering — it remains one of the most well-established, most directly modifiable risk factors in all of cardiovascular medicine — but it does mean that reading LDL with zero context can occasionally overstate or understate someone's actual risk compared to reading the full relationship between LDL-carrying and HDL-carrying particles together.
There's a related concept worth knowing here: non-HDL cholesterol, calculated simply as total cholesterol minus HDL. Unlike the ratio, non-HDL cholesterol isn't a division — it's a subtraction that captures every potentially artery-damaging particle in one number, including LDL but also VLDL, IDL, and other less commonly discussed lipoproteins that all carry the same structural protein, apolipoprotein B, found on LDL's surface. Some cardiologists consider non-HDL cholesterol an even more complete risk marker than the ratio for people with elevated triglycerides, since triglyceride-rich particles like VLDL get folded into total cholesterol and therefore into non-HDL cholesterol, but don't get separately reflected unless a doctor specifically looks. Your doctor may mention the ratio, non-HDL cholesterol, or both in the same conversation — they're related tools built from the same lipid panel, aimed at the same underlying goal of not missing risk that a single number could hide.
What a High Ratio Is Actually Doing Inside Your Arteries
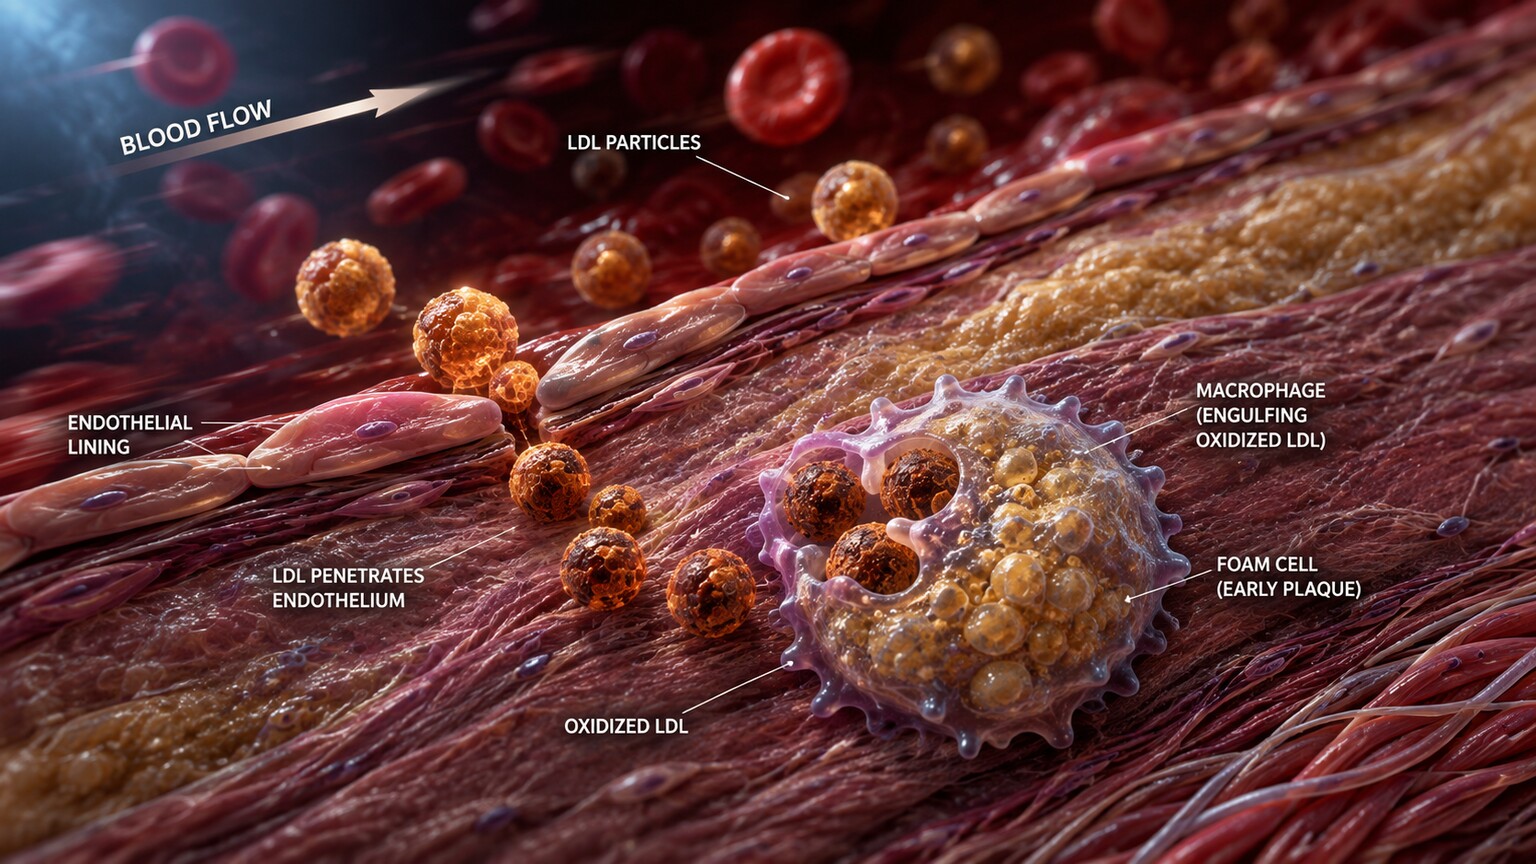
Figure 4. A skewed ratio reflects more LDL particles available to slip into the artery wall than HDL particles available to remove cholesterol from it, tipping the balance toward plaque accumulation over time.
Understanding what the ratio physically represents makes it much easier to remember why doctors care about it. Inside an artery, the process of atherosclerosis begins when LDL particles cross the artery's inner lining, called the endothelium, and become trapped in the wall beneath it. Once trapped, LDL can undergo a chemical change called oxidation, which triggers an immune response: specialized immune cells called macrophages arrive to consume the oxidized LDL, but instead of clearing the problem, they become engorged with cholesterol and transform into what's called a foam cell — one of the earliest visible building blocks of arterial plaque. Over months and years, an accumulation of foam cells, cholesterol crystals, and inflammatory debris grows into a plaque that narrows the artery and, in some cases, can rupture and trigger a blood clot, which is the direct mechanical cause of most heart attacks.
HDL works against this entire process at multiple points. Beyond removing excess cholesterol from tissues and artery walls and carrying it back to the liver, HDL particles also have antioxidant properties that can help limit the oxidation of LDL in the first place, and they carry anti-inflammatory signals that dampen some of the immune activity driving foam cell formation. A cholesterol ratio, at its core, is trying to estimate the balance between these two opposing forces — how much cholesterol is arriving in a form capable of starting this process, against how much protective capacity is available to interrupt it. A high ratio doesn't mean plaque is definitely forming at this exact moment, but it does describe a bloodstream environment tilted toward that outcome if nothing changes over the years ahead.
This isn't just a theoretical mechanism — large international studies have specifically tested whether a combined delivery-versus-cleanup measurement outperforms LDL or total cholesterol alone at predicting real-world heart attacks. The INTERHEART study, which examined risk factors for first heart attacks across more than 50 countries, found that the ratio between apolipoprotein B, the structural protein carried by LDL and its relatives, and apolipoprotein A1, the main structural protein carried by HDL, was a stronger predictor of heart attack risk than LDL or total cholesterol considered in isolation, across virtually every region and population studied. The total cholesterol to HDL ratio isn't identical to the apoB/apoA1 ratio used in that specific research, but it's built on the same underlying logic — that the balance between artery-damaging and artery-protecting particles carries more predictive weight than either side of that balance measured alone — which is part of why the simpler, more widely available ratio has held up so consistently as a clinical tool over the decades since.
What Actually Moves Your Ratio in a Healthier Direction

Figure 5. Regular aerobic exercise is one of the few interventions that reliably raises HDL while also lowering LDL, improving both halves of the ratio at once.
Because the ratio has two moving parts, there are effectively two levers to pull, and the most effective approach usually works on both simultaneously. Regular aerobic exercise is one of the few interventions well documented to raise HDL meaningfully, particularly sustained moderate-to-vigorous activity like brisk walking, running, cycling, or swimming performed consistently over weeks and months — a change that can also modestly lower LDL and triglycerides at the same time, improving the ratio from both directions at once. Quitting smoking produces a similarly dual benefit: smoking is well established to lower HDL, and quitting has been shown to raise it back up within weeks to months, on top of removing smoking's own separate, substantial contribution to cardiovascular risk.
On the diet side, replacing saturated fats — found concentrated in fatty red meat, butter, and full-fat dairy — with unsaturated fats from sources like olive oil, avocados, nuts, and fatty fish tends to lower LDL while having a neutral-to-mildly-positive effect on HDL. Soluble fiber, found in oats, beans, lentils, and fruits like apples and pears, binds to cholesterol in the digestive tract and reduces how much gets absorbed into the bloodstream, offering a specific, well-studied LDL-lowering effect. Weight loss, when relevant, tends to improve the entire lipid panel together, since excess weight — particularly around the abdomen — is closely tied to the same insulin resistance that drives both low HDL and elevated triglycerides.
Alcohol is a genuinely complicated piece of this picture and deserves a direct, honest answer rather than a vague one: moderate alcohol consumption has been associated with modestly higher HDL in some studies, which is part of where the now-outdated idea of alcohol being "heart healthy" originally came from. But this HDL effect doesn't outweigh alcohol's broader risks — including its contribution to high blood pressure, its effect on triglycerides, its role in liver disease, and its established links to certain cancers — which is why major health organizations, including the American Heart Association, do not recommend starting to drink alcohol for the purpose of improving HDL or any cardiovascular marker. For someone who already drinks, this nuance is worth understanding; for someone who doesn't drink, it isn't a reason to start.
When diet and lifestyle changes aren't enough on their own, medication becomes part of the conversation, and this is squarely a decision for a doctor to make based on someone's full risk profile rather than the ratio in isolation. Statins remain the most commonly prescribed and most extensively studied cholesterol medication, working primarily by lowering LDL substantially, which improves the ratio even without a large direct effect on HDL. Other medication classes, including fibrates and certain forms of niacin, target triglycerides and HDL more directly, though niacin in particular has become less commonly used in recent years after research questioned whether the HDL increase it produces translates into a meaningful reduction in actual heart attacks and strokes — a reminder that raising HDL through a pill doesn't automatically deliver the same protective benefit as raising it through exercise, and that the ratio itself is a useful marker, not a guaranteed target to chase by any means necessary.
Sleep and chronic stress are two commonly overlooked contributors worth mentioning as well. Poor sleep quality and short sleep duration have been associated with lower HDL and higher triglycerides in multiple studies, likely through their broader effects on insulin sensitivity and inflammation, both of which tie back into the same metabolic pathways that shape the rest of a lipid panel. Chronic, unmanaged stress raises cortisol over sustained periods, which can influence how the liver produces and clears cholesterol-carrying particles. Neither factor tends to move a ratio as dramatically as diet or exercise on its own, but for someone who has already tightened up their food choices and activity level without seeing the improvement they expected, sleep habits and stress levels are reasonable next places to look.
What the Ratio Doesn't Tell You
As useful as it is, a cholesterol ratio is a simplification, and it's worth understanding its limits so it doesn't get treated as a complete verdict on its own. It doesn't capture LDL particle size or particle number, two characteristics increasingly recognized as relevant to risk independent of the cholesterol content those particles carry — someone can have an identical ratio to someone else while carrying more numerous, smaller, denser LDL particles considered more prone to slipping into artery walls, a distinction that requires more specialized testing like apolipoprotein B or LDL particle number to detect. It also says nothing about lipoprotein(a), a genetically determined particle that behaves somewhat like LDL but carries its own independent cardiovascular risk and isn't reflected in a standard lipid panel or its ratio at all. And it doesn't account for the rest of a person's risk profile — blood pressure, blood sugar, smoking status, age, family history, and inflammation markers all feed into more complete tools like the ASCVD risk calculator that doctors use to estimate someone's actual ten-year cardiovascular risk percentage, a calculation the ratio contributes to but never fully replaces.
None of this makes the ratio meaningless — it remains one of the fastest, most accessible ways to catch a risk pattern that a single number might hide, and it's built from information nearly every routine lipid panel already provides. It simply means the ratio functions best as a prompt for a fuller conversation with a doctor, not as a standalone diagnosis to interpret alone.
What Can Temporarily Skew a Single Reading
Before treating any one ratio as the final word on cardiovascular risk, it's worth knowing that several short-term factors can shift the numbers behind it without reflecting any real, lasting change in someone's health. A recent illness or infection, even something as ordinary as a bad cold or the days following a minor surgery, can temporarily lower HDL through the body's acute inflammatory response — cholesterol particles are affected by inflammation more broadly than most people realize, which is one reason doctors generally prefer to check a lipid panel when someone is feeling well rather than in the middle of being sick. Recent heavy exercise, particularly in the day or two before a blood draw, can also cause short-term shifts in triglycerides and HDL that don't represent a person's stable baseline.
Whether the sample was drawn fasting also matters more than people often expect. Eating within several hours of a blood draw, especially a meal containing fat, temporarily raises triglycerides, and because LDL is frequently calculated rather than directly measured on a standard panel, a triglyceride spike can distort that calculated LDL number and, by extension, the ratio built from it. Alcohol consumed the evening before a lipid panel can produce a similar temporary effect. None of this means a single unusual reading should be dismissed outright, but it's a legitimate reason a doctor might ask about recent illness, exercise, fasting status, or alcohol before reacting strongly to one ratio that looks unexpectedly different from a person's prior results — and it's also why an isolated result that seems alarming is often simply rechecked under better-controlled conditions before any major decision, like starting medication, gets made based on it.
How Often the Ratio Gets Rechecked
For adults with an otherwise low cardiovascular risk profile and a ratio already in a healthy range, most general screening guidelines call for a lipid panel roughly every four to six years, which naturally means the ratio gets reassessed on that same schedule. That interval shortens considerably for anyone with additional risk factors already in the picture — a family history of early heart disease, high blood pressure, diabetes, or a personal history of smoking — where annual or biannual rechecks are more common so that any drift in the ratio gets caught early rather than years later. Anyone actively working to improve their ratio through diet, exercise, or a new medication is typically rechecked sooner still, commonly at the eight-to-twelve-week mark, since that's long enough for genuine changes in HDL, LDL, and triglycerides to show up clearly on a repeat panel without months passing with no feedback on whether the current approach is actually working.
Frequently Asked Questions
What's considered a good cholesterol ratio?
For the total cholesterol to HDL ratio, under 3.5 is generally considered optimal and under 5 is considered desirable for most adults. For the LDL to HDL ratio, under 2.5 is typically considered optimal. Both are population-level guidelines interpreted alongside a person's broader risk profile, not standalone pass-or-fail cutoffs.
Can my ratio be bad even if my total cholesterol is normal?
Yes, and this is one of the main reasons the ratio gets mentioned at all. A low HDL can push the ratio into an elevated range even when total cholesterol and LDL both look unremarkable on their own, since the ratio is measuring the relationship between the two numbers rather than either one in isolation.
Is the total cholesterol/HDL ratio the same as non-HDL cholesterol?
No. The ratio is a division (total cholesterol divided by HDL), while non-HDL cholesterol is a subtraction (total cholesterol minus HDL). They're related tools built from the same numbers, and a doctor may reference either or both, but they aren't interchangeable calculations.
How quickly can I improve my cholesterol ratio?
HDL and triglycerides can respond to consistent exercise and dietary changes within roughly two to three months, while LDL often takes a similar window to shift meaningfully through diet alone. Most doctors recheck a lipid panel around eight to twelve weeks after a significant lifestyle change to see whether the ratio has actually moved.
Does a bad ratio automatically mean I need medication?
Not automatically — that's a decision for your doctor based on your full cardiovascular risk profile, not the ratio by itself. Many people improve their ratio meaningfully through exercise, diet, and other lifestyle changes alone, while others with additional risk factors may be offered medication sooner as part of a broader prevention plan.
Conclusion
A cholesterol ratio isn't a mysterious extra test — it's simple division applied to numbers already sitting on your lipid panel, built specifically to catch a risk pattern that reading total cholesterol, LDL, and HDL as separate, unrelated lines can sometimes miss. When your doctor mentions it, they're usually pointing out that the relationship between your cholesterol-carrying particles and your cholesterol-clearing particles matters as much as either number by itself, and that relationship has a real, if imperfect, track record — reaching back to the original Framingham research and reinforced by later international studies — of adding useful information to a cardiovascular risk conversation. It's also one of the more encouraging numbers on a lipid panel to work on, since it responds to changes — more movement, less smoking, a diet built around unsaturated fats and fiber, better sleep — that improve long-term health for reasons that go well beyond a single lab value.
If your own ratio came back higher than you'd like, the most useful next step isn't panic or an attempt to memorize every cutoff mentioned in this article — it's a specific conversation with your doctor about which piece, LDL, HDL, or both, is actually driving your number, and whether recent illness, fasting status, or other short-term factors might be part of the picture. That context is what turns a single ratio from an abstract statistic into a genuinely useful starting point for protecting your long-term cardiovascular health.
Still Not Sure What Your Results Mean?
Upload your labs and get a complete, visual, plain-language interpretation of every biomarker — delivered to your inbox in under 15 minutes.
Get My ReportThis article is for educational purposes only and does not constitute medical advice. Always consult your healthcare provider regarding your specific lab results.