
Understanding the Role of Insulin in Metabolic Syndrome
Metabolic syndrome is usually described as a checklist: high blood pressure, extra weight around the waist, low HDL cholesterol, high triglycerides, and elevated blood sugar — meet three of the five, and that's the diagnosis. Presented this way, it can look like five unrelated problems that simply happen to show up together in the same person. They don't just happen to coincide — insulin resistance, a state where your body's cells stop responding normally to the hormone insulin, is the underlying mechanism that actually generates most of these five findings, one by one, through a chain of cause and effect that starts in one specific place: the fat tissue around your organs. This article traces that entire chain from the first breakdown in insulin signaling through to each of the five diagnostic criteria, so the syndrome stops looking like a coincidence and starts looking like exactly what it is — one problem with five visible symptoms.

Figure 1. Insulin resistance functions as a single upstream mechanism connected to all five diagnostic criteria of metabolic syndrome, rather than five independent conditions that coincidentally overlap.
What Insulin Resistance Actually Is
Insulin is the hormone your pancreas releases whenever you eat, and its main job is to act like a key that unlocks the door on your muscle, fat, and liver cells, letting glucose (sugar) move out of your bloodstream and into those cells to be used for energy or stored for later. Insulin resistance is what happens when those cellular doors stop responding normally to the key — the lock still exists, but it's become sticky and harder to turn. Your pancreas compensates the only way it can: by producing more insulin, flooding the bloodstream with extra keys to force enough doors open to keep blood sugar in a normal range. This compensated state, called hyperinsulinemia, can persist for years — sometimes over a decade — with completely normal blood sugar and no diagnosis of diabetes, precisely because the pancreas is working overtime behind the scenes to cover for the resistance.
It helps to understand why cells become resistant to insulin's signal in the first place, rather than simply accepting resistance as an unexplained given. At the molecular level, insulin resistance largely comes down to excess fat accumulating inside cells that aren't designed to store much of it — particularly muscle and liver cells. When these cells become overloaded with fat, byproducts of that excess fat interfere directly with the insulin receptor's internal signaling chain, essentially static on the line between the receptor on the cell's surface and the machinery inside the cell that's supposed to respond to it. The receptor itself is often still intact and capable of binding insulin normally; it's the signal transmission afterward, deep inside the cell, that breaks down. This distinction matters because it explains why simply having "more insulin receptors" or "healthier receptors" isn't the fix — the problem lives downstream of the receptor, in the cell's internal machinery, which is exactly why reducing the fat overload itself (through the interventions discussed later in this article) is what actually restores normal signaling, rather than any receptor-targeted approach.
This is the single most important fact for understanding metabolic syndrome: the pancreas's compensation is not free. That extra insulin circulating in your bloodstream doesn't just sit there waiting to move glucose — it actively signals to other tissues throughout the body, and several of those other tissues respond to chronically elevated insulin in ways that are actively harmful, setting off the specific downstream effects that show up, one by one, as the other four criteria of metabolic syndrome.
Where Insulin Resistance Actually Starts: Visceral Fat
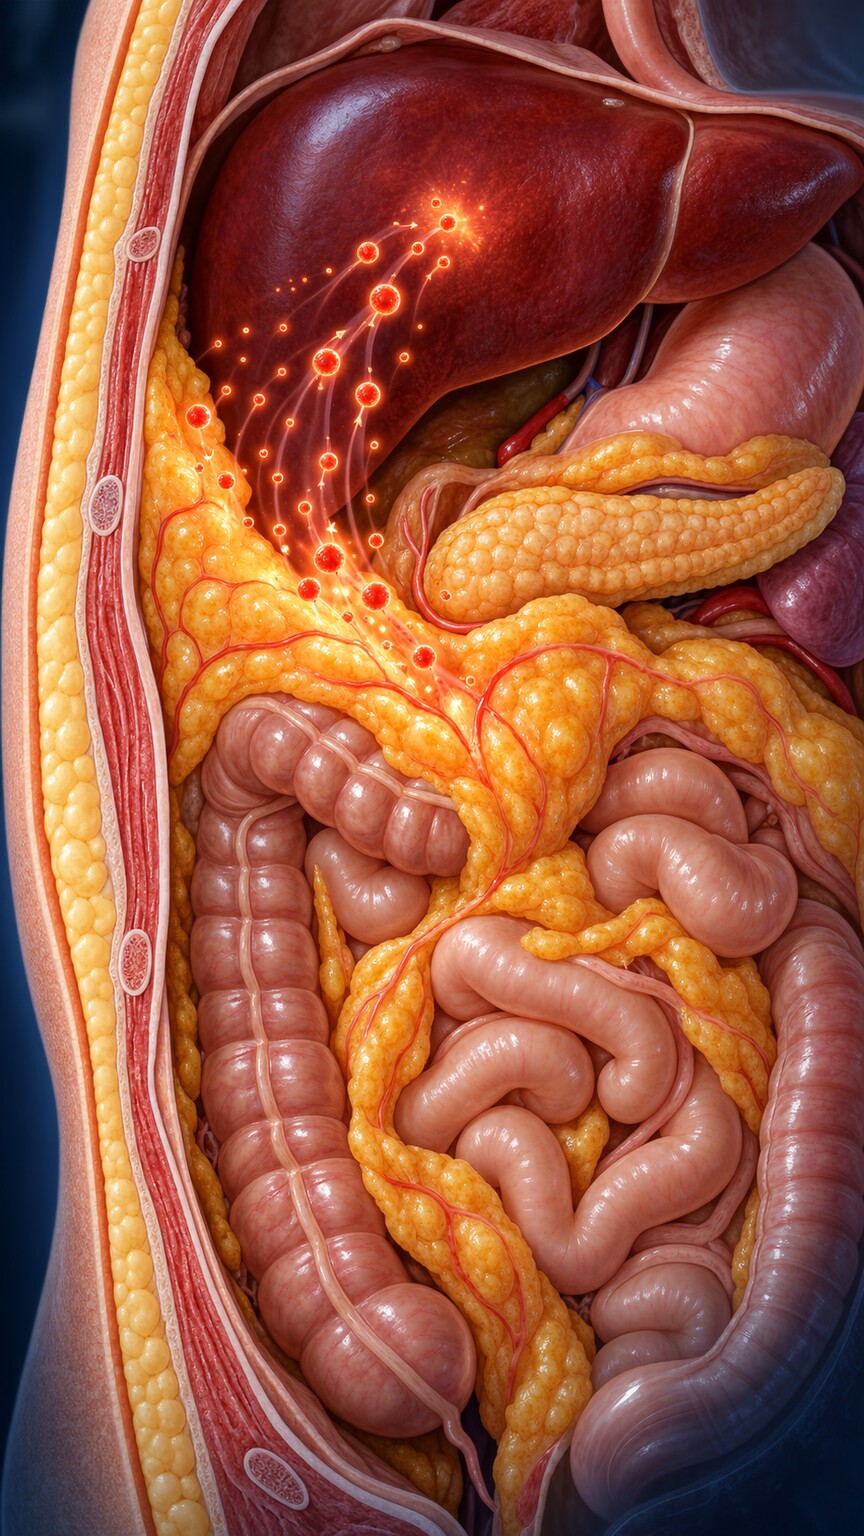
Figure 2. Visceral fat, wrapped around the abdominal organs, behaves like an active hormone-producing tissue, releasing inflammatory signals that directly interfere with insulin's ability to signal nearby cells.
Not all body fat behaves the same way, and this distinction is central to the whole story. Subcutaneous fat — the kind you can pinch under the skin — is relatively metabolically quiet. Visceral fat, the fat that accumulates deep in the abdomen, wrapped around the liver, pancreas, and intestines, behaves completely differently: it functions almost like an endocrine organ in its own right, actively releasing a stream of inflammatory signaling molecules called cytokines directly into the portal blood supply that feeds straight into the liver. This is why waist circumference, not overall body weight or BMI, is the specific measurement used in metabolic syndrome's diagnostic criteria — it's a reasonably good proxy for how much of this specific, metabolically active visceral fat someone is carrying, which matters far more to this whole process than total body fat does.
These inflammatory signals released by visceral fat directly interfere with the insulin-signaling machinery inside nearby liver and muscle cells, essentially jamming the lock described earlier. This is widely considered the initiating event for the entire cascade in most cases of metabolic syndrome: visceral fat accumulates, it releases inflammatory cytokines, those cytokines create localized insulin resistance in the liver and surrounding tissue, and the pancreas responds by producing more insulin to compensate — kicking off the chronic hyperinsulinemia that then goes on to affect blood pressure, cholesterol, and triglycerides through the separate mechanisms covered next.
It's worth being specific about why visceral fat, rather than fat in general, plays this outsized role, since the distinction has real practical implications. Visceral fat cells are, on average, larger and under greater metabolic stress than subcutaneous fat cells, and this stress itself triggers the release of the inflammatory cytokines described above — two of the most-studied being TNF-alpha and IL-6, both of which directly interfere with the insulin-signaling chain inside nearby cells when present in excess. Visceral fat's location also matters enormously: because it sits close to the intestines and drains directly into the portal vein, the same blood vessel that feeds the liver, whatever it releases reaches the liver in a far more concentrated, undiluted form than fat released from elsewhere in the body, which is part of why the liver in particular bears such a large share of the downstream damage described in the sections on triglycerides and HDL below.
Curious what your own insulin, glucose, or lipid panel results actually mean together? Upload your results and get a complete, plain-language breakdown in under 15 minutes.
Analyze My ResultsCriterion One: How Insulin Resistance Raises Blood Pressure
Chronically high insulin levels affect blood pressure through at least two distinct, well-documented mechanisms working together. First, insulin normally has a mild blood-vessel-relaxing effect in a healthy person, but in an insulin-resistant state, this specific effect is blunted while insulin's other effects remain active — including a direct stimulating effect on the sympathetic nervous system, the "fight or flight" system that increases heart rate and constricts blood vessels. This selective resistance — some of insulin's actions being blunted while others stay fully active — creates a net effect that pushes blood pressure upward rather than helping regulate it.
Second, high insulin levels cause the kidneys to reabsorb more sodium than they normally would, rather than excreting it in urine. More retained sodium means more retained water, which increases overall blood volume — and more volume moving through the same-sized blood vessels means higher pressure, the same basic physics as adding more water to a garden hose without widening the hose itself. Both mechanisms operate continuously and quietly, which is part of why the blood pressure elevation in metabolic syndrome tends to develop gradually, without any single dramatic trigger, tracking the slow buildup of insulin resistance itself rather than appearing suddenly.
A third, somewhat less widely discussed mechanism compounds the first two: chronically elevated insulin promotes thickening and stiffening of the walls of small blood vessels over time, partly by stimulating the growth of smooth muscle cells within the vessel wall itself. Stiffer, less elastic blood vessels resist the normal expansion and contraction that healthy vessels use to accommodate each heartbeat's surge of blood, and vessels that can't expand as readily register that same volume of blood as higher pressure — a structural change that, unlike the sodium-retention mechanism, develops more slowly but tends to persist longer once established, which is part of why blood pressure in longstanding insulin resistance can take considerably longer to normalize than it took to develop, even after the underlying insulin resistance itself has meaningfully improved.
Criterion Two and Three: Why Insulin Resistance Distorts Your Cholesterol Panel
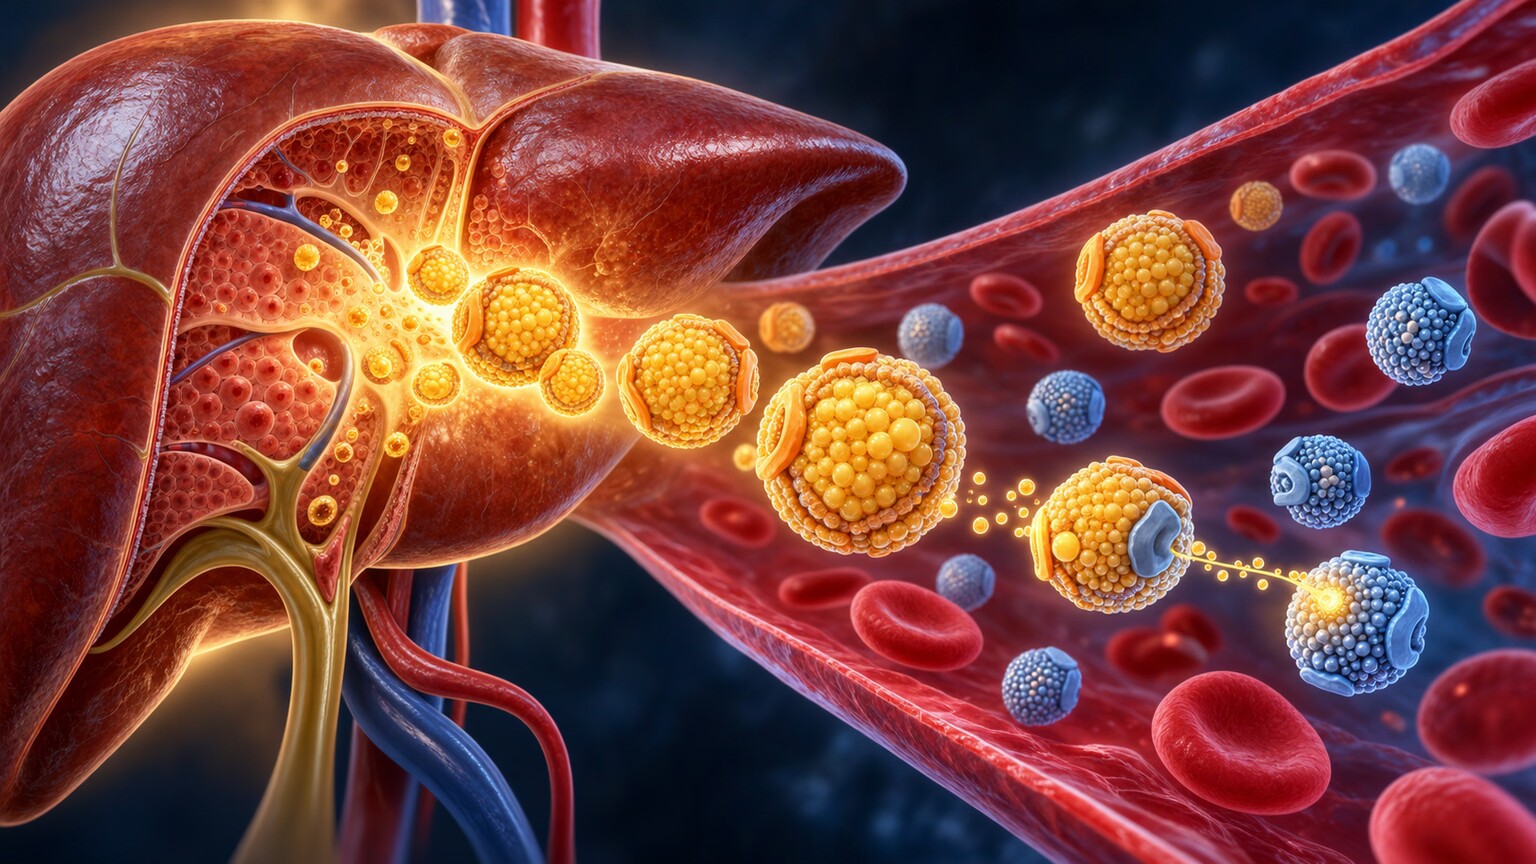
Figure 3. An insulin-resistant liver overproduces VLDL particles loaded with triglycerides, and the resulting particle-exchange process is what simultaneously drives triglycerides up and HDL cholesterol down.
Metabolic syndrome's lipid criteria — high triglycerides and low HDL ("good") cholesterol — aren't two separate cholesterol problems; they're two visible symptoms of a single process happening inside an insulin-resistant liver. Normally, insulin suppresses the liver's own production of fat and glucose once enough is already circulating. In an insulin-resistant liver, that suppression signal gets ignored specifically for fat production (a pattern called selective hepatic insulin resistance), while the liver simultaneously receives a flood of free fatty acids arriving from resistant fat tissue elsewhere in the body, which is now leaking out stored fat more readily than it should. The overwhelmed, resistant liver responds by packaging up all this excess fat into triglyceride-rich particles called VLDL (very-low-density lipoprotein) and pumping them out into the bloodstream in excess — showing up directly as the elevated triglyceride number on a standard lipid panel.
The low HDL half of this picture is a direct downstream consequence of that same VLDL overproduction, not an unrelated coincidence. All of these lipid particles constantly exchange cargo with each other in the bloodstream through a transfer protein: triglyceride-loaded VLDL trades some of its triglycerides to HDL particles in exchange for HDL's cholesterol. When VLDL is overproduced, as it is here, this exchange happens more aggressively, loading HDL particles up with triglycerides instead of their normal cholesterol cargo. Triglyceride-loaded HDL is then broken down and cleared from the bloodstream by the liver considerably faster than normal HDL is — which is precisely why the same insulin-resistant state that raises triglycerides simultaneously lowers HDL: they're two ends of the exact same molecular exchange, not two separate cholesterol problems that happen to travel together.
This same mechanism has a third, less visible consequence worth understanding, since it explains why a standard cholesterol panel can sometimes understate someone's actual cardiovascular risk. The VLDL overproduction driving this whole picture doesn't just raise triglycerides and lower HDL — it also shifts LDL ("bad" cholesterol) particles toward a smaller, denser subtype through the same triglyceride-exchange process described above, even when the total LDL number on a standard panel looks entirely unremarkable. These small, dense LDL particles are considered more prone to penetrating the artery wall and contributing to plaque buildup than larger, more buoyant LDL particles carrying the same total cholesterol amount, which is part of why someone with insulin resistance and a "normal" LDL number can still be carrying meaningfully elevated cardiovascular risk that a standard lipid panel doesn't fully capture — this specific pattern, sometimes summarized as high triglycerides, low HDL, and small dense LDL together, is common enough in insulin-resistant states that it's sometimes referred to as the "lipid triad" of metabolic syndrome.
Criterion Four: The Direct Line to Elevated Blood Sugar
Elevated fasting glucose is, in one sense, the most straightforward of the five criteria to connect back to insulin resistance, since it's the most literal consequence of the mechanism this entire article has been describing. For years, the pancreas compensates for insulin resistance by producing more and more insulin, and as long as it can keep up with demand, blood sugar stays normal — this is why someone can be significantly insulin-resistant for a decade or more with completely normal glucose readings, all while the pancreas works progressively harder behind the scenes. Elevated fasting glucose specifically marks the point where the pancreas's beta cells — the specific cells responsible for producing insulin — begin to fatigue and lose some of their capacity to keep up with the ever-increasing demand for compensation, a gradual decline rather than a sudden failure, unfolding over months to years rather than overnight.
This is exactly why fasting glucose is considered a relatively late marker of insulin resistance rather than an early one, despite being the criterion most people associate with metabolic problems by default. Fasting insulin, or a calculated ratio like HOMA-IR that combines fasting glucose and fasting insulin together, can flag the underlying resistance years before glucose itself ever rises out of the normal range — glucose only moves once the compensating pancreas starts to lose the race, meaning a normal glucose reading, taken alone, provides considerably less reassurance about someone's underlying metabolic health than most people assume.
The specific way beta cells fatigue also matters for understanding why glucose rises the way it does once compensation starts failing, rather than dropping suddenly or all at once. Beta cells aren't a uniform, interchangeable population — they include a functional reserve that only gets called into action during periods of especially high demand, and this reserve is generally the first capacity to be lost as insulin resistance grinds on for years, well before the "baseline" beta cell population shows any strain at all. This is why fasting glucose often rises gradually, and why the earliest sign of trouble frequently shows up first as an exaggerated blood sugar spike after a large meal — a demand moment that draws on that dwindling reserve capacity — rather than as a fasting glucose number that's already abnormal at rest. This same phenomenon is part of why a standard fasting glucose test, checked in isolation, can look reassuringly normal even in someone whose post-meal glucose control has already meaningfully deteriorated, which is one reason some clinicians favor an oral glucose tolerance test or continuous glucose monitoring over a single fasting draw when investigating early metabolic dysfunction specifically.
Criterion Five: Waist Circumference as Both Cause and Consequence

Figure 4. Waist circumference, measured at a specific point above the hip bones, is used clinically as a simple external proxy for how much metabolically active visceral fat a person is carrying internally.
Waist circumference deserves a second look here, because it plays a genuinely unusual dual role in this whole story compared to the other four criteria: it's both an early cause, sitting at the very start of the chain described earlier, and a visible, external consequence, since insulin resistance itself makes it progressively easier to accumulate more visceral fat over time, not less. Elevated insulin promotes fat storage as one of its normal functions, and specifically favors storing that fat viscerally when the fat-storage signaling elsewhere in the body has already become resistant, creating a self-reinforcing cycle where existing visceral fat drives more insulin resistance, and that resistance in turn favors depositing more visceral fat rather than storing it elsewhere.
This is part of why waist circumference measured with a simple tape measure, positioned at a specific landmark just above the hip bones, remains such a clinically useful data point despite being far less technologically sophisticated than a fasting insulin blood test — it captures both a cause and a live, ongoing consequence of the same underlying process in one simple external measurement, which is exactly why it earned a permanent place among the five official diagnostic criteria rather than being replaced entirely by blood-based markers.
It's also worth knowing that the specific waist circumference threshold used to flag risk isn't identical for everyone, since body composition and typical fat distribution genuinely differ across populations. Major diagnostic frameworks generally use lower waist circumference cutoffs for people of South Asian, Southeast Asian, and Latin American descent compared to the cutoffs commonly applied to people of European descent, reflecting research showing that visceral fat accumulates, and starts driving the same inflammatory cascade described earlier, at a smaller absolute waist size in these populations. This is a meaningful, clinically relevant nuance — it means two people with the exact same waist measurement can carry meaningfully different visceral fat-related risk depending on population-specific patterns of fat distribution, which is why population-adjusted cutoffs, not one universal number, are the current recommended standard.
Why Someone Can Have Normal Glucose and Still Have Metabolic Syndrome
One of the more confusing aspects of metabolic syndrome for people newly diagnosed with it is discovering that a completely normal glucose reading didn't protect them from the diagnosis at all. Given everything covered above, this makes complete sense: glucose is the last domino to fall in this entire chain, not the first. Someone can have significant visceral fat, elevated blood pressure from the sodium-retention mechanism, high triglycerides and low HDL from an overburdened liver, and a wide waist circumference — four full criteria — all while their pancreas is still successfully compensating with extra insulin and keeping glucose itself in the normal range. This person absolutely has metabolic syndrome, and arguably has caught the underlying insulin resistance at a more favorable, earlier stage than someone whose glucose has already started climbing, precisely because their beta cells haven't yet started to fatigue.
This same logic runs in the other direction too, and it's just as important to understand: someone can have an elevated glucose reading in isolation, with entirely normal blood pressure, lipids, and waist circumference, and not meet criteria for metabolic syndrome at all, since the diagnosis requires three of the five criteria together, not any single one on its own. An isolated elevated glucose reading has plenty of causes that have nothing to do with the insulin-resistance cascade described in this article — certain medications, acute illness or stress at the time of the blood draw, or a different, less common form of diabetes entirely. This is exactly why metabolic syndrome is deliberately defined as a cluster of at least three findings rather than any single abnormal number, and why a doctor evaluating one abnormal result will typically look at the surrounding picture in full before drawing any conclusions about an underlying insulin-resistance process specifically.
A Worked Example: Tracing One Person's Numbers Back to the Same Root Cause

Figure 5. Five individually abnormal values on a routine panel — blood pressure, triglycerides, HDL, glucose, and waist circumference — trace back through distinct but related mechanisms to the same root cause.
Consider a 47-year-old man with a 42-inch waist who goes in for a routine physical. His blood pressure reads 134/88, mildly elevated. His lipid panel shows triglycerides of 210 mg/dL and HDL of 36 mg/dL — both outside the healthy range, in opposite directions. His fasting glucose comes back at 108 mg/dL, just above the 100 mg/dL cutoff. Looking at these five numbers on a printed report, in isolation, might suggest five separate problems needing five separate conversations: a mention of watching sodium intake, a cholesterol medication discussion, a pre-diabetes warning, and a suggestion to lose weight.
Understanding the mechanism connecting them changes the conversation entirely. His visceral fat, reflected in that 42-inch waist, has been releasing inflammatory signals that created insulin resistance in his liver and muscle tissue, almost certainly for years before this particular test. His pancreas has been compensating with elevated insulin this entire time — insulin that pushed his blood pressure up through sodium retention and sympathetic activation, forced his liver into VLDL overproduction that simultaneously raised his triglycerides and lowered his HDL through the shared particle-exchange mechanism, and has only recently started losing the compensation battle, letting his glucose creep just over the normal threshold. One mechanism, traced through four distinct but connected pathways, produced every abnormal number on that page — which reframes his treatment plan from "manage five separate problems" to "address the one upstream driver responsible for all five," primarily through strategies that specifically reduce insulin resistance and visceral fat rather than treating each number in isolation.
His doctor, recognizing this pattern, orders a fasting insulin level alongside a standard follow-up panel — a step that isn't part of the official five criteria but adds real clarity to his specific case. His fasting insulin comes back meaningfully elevated even relative to his mildly elevated glucose, and his calculated HOMA-IR score confirms substantial insulin resistance. This additional data point doesn't change his diagnosis, since he already met three of the five official criteria, but it does something else genuinely useful: it gives him and his doctor a direct, quantifiable marker to track over the following months as he makes changes, rather than waiting for the slower-moving, less sensitive criteria — blood pressure, lipids, waist circumference — to show measurable improvement, since fasting insulin and HOMA-IR typically respond to meaningful lifestyle changes considerably faster than the downstream criteria that took years to develop in the first place.
Testing for the Root Cause Directly, Rather Than Waiting for the Symptoms

Figure 6. A fasting insulin measurement, unlike the five standard diagnostic criteria, tests the root mechanism directly and can flag developing insulin resistance years before any downstream criterion becomes abnormal.
Everything described so far in this article explains why the five official metabolic syndrome criteria are, in a real sense, five indirect fingerprints of insulin resistance rather than direct measurements of it. None of the standard diagnostic blood pressure cuff, lipid panel, or glucose test actually measures insulin itself — they measure downstream effects that only become visible after insulin resistance has been building, often for years. A fasting insulin test, by contrast, measures the hormone directly, and because compensatory hyperinsulinemia is typically the very first measurable change in this entire cascade, it can flag a developing problem well before waist circumference, blood pressure, lipids, or glucose have moved out of their normal ranges at all.
Fasting insulin is even more useful when combined with fasting glucose into a calculated ratio called HOMA-IR (homeostatic model assessment of insulin resistance), which estimates how hard the pancreas is having to work to keep glucose normal — a genuinely more direct window into the mechanism this entire article has been describing than any single criterion on the standard metabolic syndrome checklist. A someone with a normal fasting glucose but a meaningfully elevated HOMA-IR score is, in effect, looking at laboratory evidence of the exact compensatory state described earlier under "Criterion Four," well before that compensation starts to fail and glucose itself begins climbing. This is precisely why some clinicians recommend checking fasting insulin proactively in people with strong risk factors — a large waist circumference, a family history of type 2 diabetes, or early signs of skin changes like acanthosis nigricans — rather than waiting for three of the five official criteria to accumulate before acting.
Acanthosis nigricans, mentioned above, is worth a brief explanation of its own, since it's one of the few visible physical signs directly tied to hyperinsulinemia rather than any of the five official criteria. It appears as darkened, thickened, velvety patches of skin, most commonly at the back of the neck, in the armpits, or in skin folds, and develops because chronically elevated insulin, at high enough concentrations, cross-reacts with a closely related growth-factor receptor on skin cells, stimulating extra skin cell growth in those areas. Its presence is a genuinely useful, no-cost visual clue that hyperinsulinemia has likely been present for a meaningful stretch of time, and its appearance — particularly in a child or adolescent, a population where it deserves particular attention since it can be one of the earliest visible signs of developing insulin resistance well before any standard lab criteria turn abnormal — often prompts exactly the kind of proactive fasting insulin testing described above.
What Actually Improves Insulin Sensitivity
Because insulin resistance is the shared root cause running through every criterion described above, interventions that improve insulin sensitivity tend to move multiple metabolic syndrome numbers at once, rather than requiring five separate treatments for five separate problems. Resistance exercise and regular physical activity increase how efficiently muscle tissue takes up glucose, directly counteracting the cellular resistance described at the very start of this article, independent of any weight change. A relatively modest reduction in visceral fat specifically — even before someone reaches an overall "healthy" body weight — has been shown to meaningfully improve insulin sensitivity, since visceral fat is disproportionately responsible for the inflammatory signaling that starts the whole cascade in the first place. Adequate sleep and stress management matter more than commonly assumed here too, since poor sleep and chronic stress both independently raise cortisol and other counter-regulatory hormones that work directly against insulin's normal signaling.
Dietary patterns that reduce the frequency and magnitude of blood sugar spikes — generally meaning a reduction in refined carbohydrates and added sugars in favor of fiber, protein, and healthy fats — reduce the total compensatory demand placed on the pancreas over time, giving beta cells a better chance of keeping pace with demand rather than gradually fatiguing. None of these interventions target blood pressure, triglycerides, HDL, or glucose directly and separately — they all work by improving the same underlying insulin sensitivity, which is exactly why meaningful, sustained lifestyle changes so often move several metabolic syndrome numbers simultaneously rather than one at a time.
Medication also has a role in some cases, and understanding the shared mechanism helps explain why certain drugs prescribed for one specific criterion sometimes produce noticeable improvement in others as a side benefit. Metformin, most commonly prescribed for elevated glucose, works partly by improving insulin sensitivity in the liver specifically, reducing the excess glucose production that liver cells generate when insulin resistance is present — which is why some people taking it for blood sugar also see modest favorable shifts in their triglycerides, since the same liver-level improvement that helps regulate glucose output also reduces the VLDL overproduction described earlier. This kind of overlapping benefit, appearing in a criterion the medication wasn't specifically prescribed to treat, is itself further evidence of just how interconnected these five findings actually are at the mechanistic level — a medication doesn't need to separately target blood pressure, lipids, and glucose to move all three, if it's genuinely improving the shared root cause underlying each of them.
Frequently Asked Questions
Can you have metabolic syndrome with a normal weight?
Yes. Someone can carry significant visceral fat around their internal organs while having an overall normal body weight or BMI, a pattern sometimes called "normal weight obesity," and still develop the same insulin-resistance-driven cascade described throughout this article.
Is metabolic syndrome the same thing as prediabetes?
No, though they overlap heavily and share the same root cause. Prediabetes refers specifically to blood sugar in an elevated-but-not-diabetic range, while metabolic syndrome is a broader diagnosis based on any three of five criteria, only one of which is glucose.
Does having metabolic syndrome mean I will develop type 2 diabetes?
Not necessarily, but it substantially raises the risk, since metabolic syndrome reflects the same underlying insulin resistance and pancreatic compensation process that eventually leads to type 2 diabetes if beta cell fatigue continues to progress.
Which of the five criteria usually appears first?
There's no single universal order, but elevated waist circumference and mild blood pressure or lipid changes commonly precede elevated fasting glucose, since glucose typically only rises once the pancreas's compensatory insulin production starts to fall behind.
Can metabolic syndrome be reversed?
In many cases, yes, particularly when caught in earlier stages — since the underlying driver is insulin resistance rather than irreversible organ damage, interventions that meaningfully improve insulin sensitivity can improve or resolve multiple criteria simultaneously.
Is fasting insulin testing part of the standard metabolic syndrome diagnosis?
No, the official diagnosis relies only on the five standard criteria (waist circumference, blood pressure, triglycerides, HDL, and fasting glucose). Fasting insulin is a supplementary test some clinicians use to catch the underlying resistance earlier, not a required diagnostic criterion itself.
What is acanthosis nigricans, and why is it relevant here?
It's a darkened, velvety skin patch, most often on the neck or in skin folds, caused by chronically elevated insulin cross-reacting with a skin growth-factor receptor. Its presence can be one of the earliest visible signs of developing insulin resistance.
Conclusion
Metabolic syndrome's five diagnostic criteria read like a checklist, but they aren't five independent findings that happen to cluster together by chance — they're five different downstream symptoms of one shared mechanism: chronically elevated insulin, compensating for cellular resistance that began, in most cases, with inflammatory signaling from visceral fat. Blood pressure rises through sodium retention and sympathetic activation. Triglycerides rise and HDL falls through the same liver-driven particle exchange. Glucose rises only once pancreatic compensation starts to fail. Understanding this shared mechanism changes how the whole diagnosis should be approached — not as five separate numbers each needing their own explanation, but as five visible expressions of one process that responds, often together, to the same underlying interventions.
That reframing has a genuinely practical payoff: it means a single, well-chosen conversation with a doctor about reducing visceral fat and improving insulin sensitivity — rather than five separate conversations about five separate numbers — is usually the more accurate and more actionable way to think about a metabolic syndrome diagnosis, whether the goal is treating it once it's present or catching the underlying resistance well before three criteria ever accumulate at all, since the earlier that shared root cause is addressed, the less work each of the five downstream criteria eventually needs to reverse on its own.
Still Not Sure What Your Results Mean?
Upload your labs and get a complete, visual, plain-language interpretation of every biomarker — delivered to your inbox in under 15 minutes.
Get My ReportThis article is for educational purposes only and does not constitute medical advice. Always consult your healthcare provider regarding your specific lab results.