
What Does It Mean If Insulin Is High But A1C Is Normal?
If your fasting insulin came back high while your A1C — the blood test that reflects your average blood sugar over roughly the past three months — landed comfortably in the normal range, you are not looking at a lab error, and you are not off the hook. This combination is one of the most common and most consequential patterns in early metabolic disease, and it has a name: compensated insulin resistance. In plain terms, it means your pancreas has quietly started working much harder than it should have to, pumping out extra insulin to force your blood sugar to stay normal. The A1C test is, by design, only capable of telling you whether that strategy is currently succeeding — it says nothing about how much effort your body is spending to make it look that way. A high insulin number next to a normal A1C is often the earliest measurable warning sign of a problem that, left unaddressed, tends to take years to fully reveal itself on standard glucose testing. Understanding why these two numbers can diverge so sharply — and what to do once you see it happen in your own results — is exactly what this article will walk through.
Curious what the rest of your metabolic panel is telling you? Upload your results and get a complete, plain-language breakdown in under 15 minutes.
Analyze My ResultsThe Short Answer, Then the Full Picture
High insulin with a normal A1C almost always means your body is still able to keep your blood sugar under control, but only by producing more insulin than a metabolically healthy person would need. Think of insulin as a key that unlocks your cells so that glucose (blood sugar) can move out of your bloodstream and into your muscles, liver, and fat tissue, where it gets used for energy or stored. When your cells become "insulin resistant," the locks on those cellular doors get stiffer — the key still works, but it takes more of it, turned harder, to get the same door open. Your pancreas responds to this stiffness the same way you'd respond to a sticky lock: it pushes more insulin into your bloodstream to compensate. For a while — often for years — this strategy works perfectly well from the outside. Your blood sugar stays in range, your A1C stays normal, and a standard checkup gives you a clean bill of health. But the extra insulin your pancreas is grinding out to make that happen is not free. It has its own separate list of consequences, and it's also a countdown: pancreatic beta cells (the insulin-producing cells) can only sustain that elevated output for so long before they start to tire out, which is usually the point at which glucose numbers finally start climbing and the A1C stops looking so reassuring.
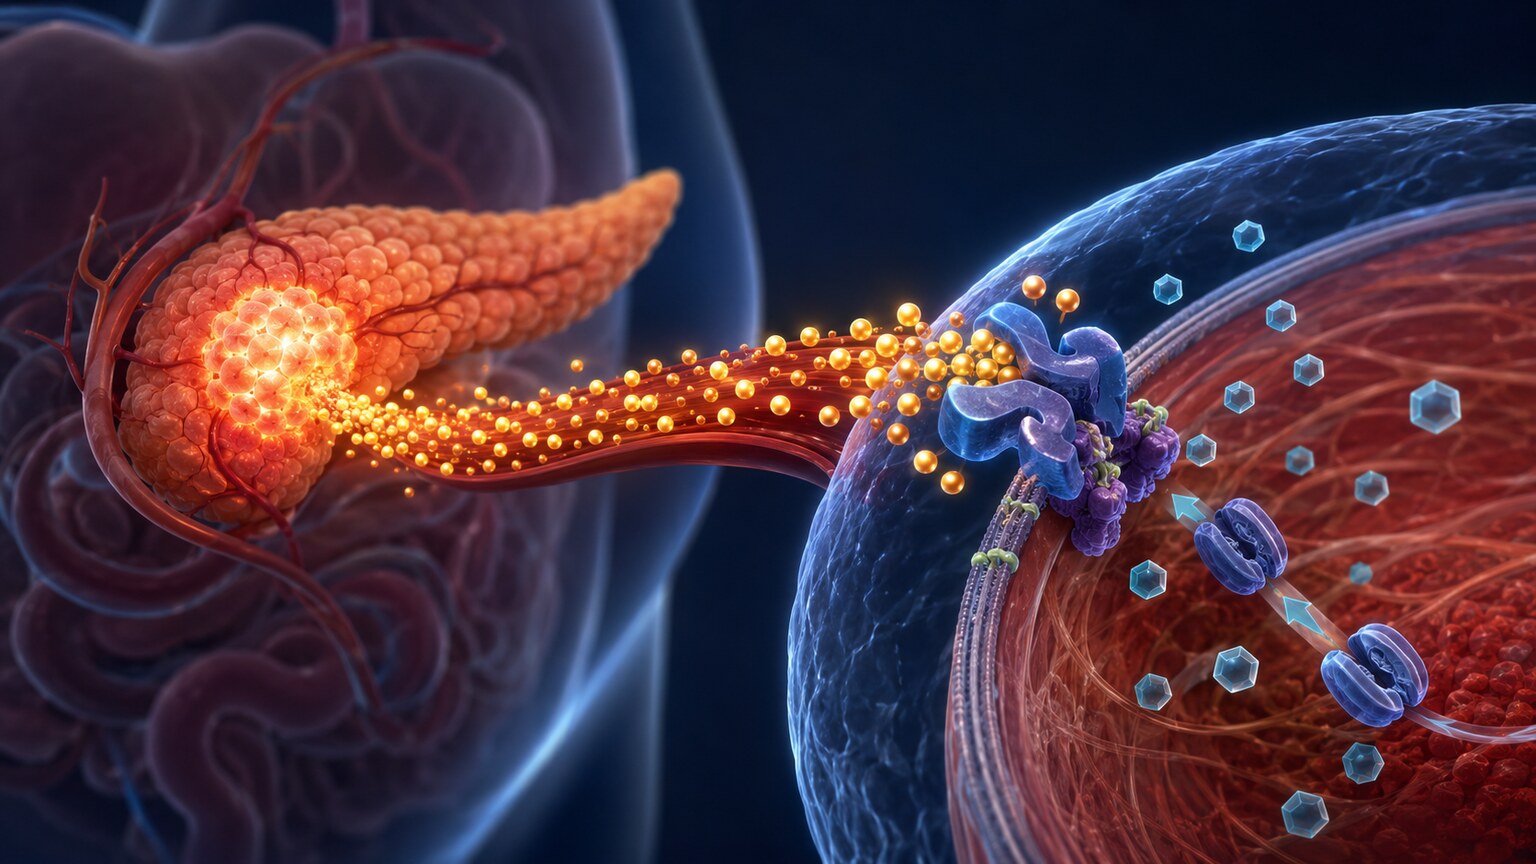
Figure 1. Insulin resistance forces the pancreas to release more insulin than normal to move the same amount of glucose into cells.
What Insulin and A1C Are Each Actually Measuring
To understand why these two numbers can tell such different stories, it helps to know exactly what each test is built to capture. A fasting insulin test measures the concentration of the hormone insulin circulating in your blood at a single moment, after roughly eight to twelve hours without food. It's a snapshot of how hard your pancreas is currently working. A1C, formally called hemoglobin A1C or glycated hemoglobin, measures something completely different: the percentage of your red blood cells' hemoglobin protein that has glucose molecules chemically stuck to it. Because red blood cells live for about two to three months before your body replaces them, and because glucose attaches to hemoglobin gradually and permanently over that entire lifespan, A1C functions as a rolling average of your blood sugar over the preceding two to three months — not a current-moment reading like fasting glucose, and not a measure of insulin at all.
This distinction matters enormously. A1C was never designed to detect how much insulin your body needs to keep blood sugar normal — it was designed to detect whether blood sugar itself has actually drifted out of normal range over time. As long as your pancreas can still produce enough insulin to keep glucose in check, A1C will keep reporting "normal," regardless of whether that control is coming easily or coming at the cost of a pancreas working two or three times harder than it should. This is precisely why insulin resistance is sometimes described in the research literature as a "silent" or "subclinical" process — it can be measurably present in a fasting insulin or HOMA-IR (Homeostatic Model Assessment of Insulin Resistance) result years before it ever shows up as an abnormal A1C or fasting glucose.
The Physiology: How Compensation Actually Works
To really picture what's happening, it helps to walk through the biology step by step. Insulin resistance typically begins inside your cells — most importantly in muscle, liver, and fat tissue — where a combination of factors (excess visceral fat around the organs, chronic low-grade inflammation, physical inactivity, certain genetic predispositions, and high circulating free fatty acids) interferes with the normal signaling cascade that insulin uses to open glucose channels. The insulin receptor on the surface of the cell is still there, and insulin can still bind to it, but the internal chain of molecular signals that's supposed to follow — ultimately telling the cell to move GLUT4 glucose transporters to its surface — becomes progressively less responsive. The practical result is that a "normal" amount of insulin no longer gets the job done as efficiently.
Your pancreas has a remarkably sensitive feedback system for detecting this. The beta cells that produce insulin, clustered in structures called the islets of Langerhans, are constantly sensing blood glucose levels in real time. The moment they detect that glucose is lingering slightly higher than it should after a meal — even by an amount too small to move your A1C — they respond by secreting more insulin. This is not a conscious or gradual adjustment; it happens on a meal-by-meal, almost minute-by-minute basis, and it is remarkably effective. In many people, beta cells can increase their insulin output by two, three, or even more times the baseline amount and still succeed in keeping blood glucose fully within the normal range. That successful compensation is exactly what a normal A1C is showing you — not the absence of a problem, but the presence of a problem that your body has, so far, been strong enough to out-produce.
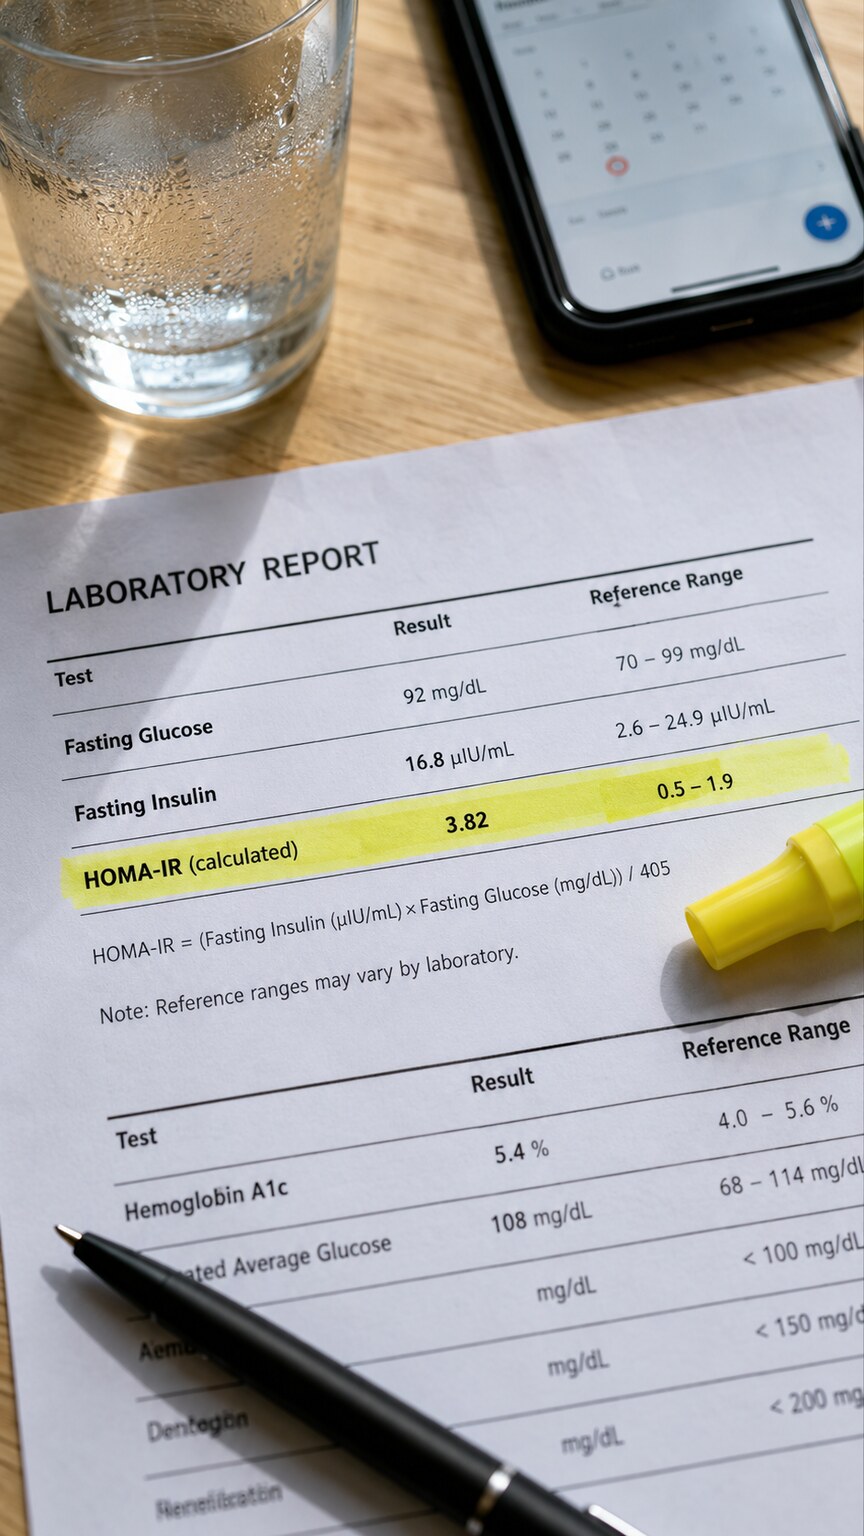
Figure 2. HOMA-IR combines fasting glucose and fasting insulin into a single index that can flag resistance before A1C does.
This is also why clinicians and researchers who focus on early metabolic risk often reach for a calculation called HOMA-IR rather than relying on A1C or fasting glucose alone. HOMA-IR takes your fasting glucose and fasting insulin values together and runs them through a simple formula (fasting glucose in mg/dL multiplied by fasting insulin in µIU/mL, divided by 405) to estimate how hard your body is working to maintain normal glucose. Because it incorporates insulin directly, HOMA-IR can flag a resistance pattern that A1C and fasting glucose, used alone, would both report as entirely unremarkable. Multiple longitudinal studies — including data drawn from the long-running Framingham Offspring Study — have shown that elevated fasting insulin and HOMA-IR can predict future development of type 2 diabetes and cardiovascular events years in advance of any abnormality appearing on standard glucose testing.
None of this means A1C is a flawed or useless test — it remains one of the best available tools for diagnosing diabetes and monitoring long-term glucose control once dysfunction has progressed far enough to actually raise blood sugar. What it means is that A1C is a lagging indicator by design, built to catch a problem after glucose has already drifted upward, while fasting insulin is closer to a leading indicator, capable of catching the compensatory strain your body is under well before that drift begins.
Why This Pattern Is So Common — and So Often Missed
Insulin resistance affecting a normal A1C isn't a rare edge case; it's arguably the default early phase of nearly every case of type 2 diabetes that ever develops. Population studies estimate that a substantial share of American adults — commonly cited figures range from roughly one in three to as many as one in two, depending on the population studied and the criteria used — have some meaningful degree of insulin resistance, and the overwhelming majority of them have never been told this, because standard primary care panels typically check fasting glucose and A1C, not fasting insulin. Fasting insulin is simply not part of a routine annual physical in most cases; it usually only gets ordered when a clinician specifically suspects a metabolic issue, when it's part of a fertility workup (insulin resistance is closely tied to polycystic ovary syndrome, or PCOS), or when a patient specifically requests it. This means the single most useful early-warning number for metabolic disease is also the one most people never see — which is exactly why a high insulin, normal A1C result, once someone finally does get it tested, so often comes as a surprise.
What Tends to Drive This Pattern
Insulin resistance rarely has one single cause; it's typically the product of several overlapping factors compounding over years. Excess visceral fat — the fat stored around and inside the abdominal organs, as opposed to fat stored just under the skin — is one of the most consistently identified drivers, because visceral fat tissue is metabolically active and releases inflammatory signaling molecules and free fatty acids that directly interfere with insulin's ability to work at the cellular level. Chronic physical inactivity compounds this, since regularly contracting muscle is one of the most powerful tools the body has for pulling glucose out of the blood independent of insulin. Diet patterns heavy in refined carbohydrates and added sugars, which drive frequent and pronounced insulin spikes, can gradually push the system toward resistance over time, particularly when combined with excess calorie intake and weight gain. Chronic sleep deprivation and poorly managed chronic stress both raise cortisol, a hormone that directly antagonizes insulin's effects. Genetics also plays a meaningful role — family history of type 2 diabetes is one of the strongest known predictors of developing insulin resistance, independent of body weight. And a number of medical conditions and medications — PCOS, certain corticosteroids, some antipsychotic medications — are also well-documented contributors. In most real people, it's a combination of several of these factors rather than any single one acting alone.

Figure 3. Regular muscle contraction from exercise pulls glucose into cells through a pathway that works independently of insulin.
It's worth being clear that having one or more of these risk factors does not guarantee insulin resistance will develop, and plenty of people who are not overweight by conventional standards — sometimes referred to in the research literature as having "normal-weight" or "lean" insulin resistance — still show this pattern, often driven more heavily by visceral fat distribution, genetics, or muscle composition than by total body weight. This is one more reason fasting insulin can be so clinically useful: it doesn't rely on assumptions about who is or isn't "supposed to" be at risk based on appearance alone. The number reflects what's actually happening inside the body, not what a person looks like on the outside.
Who Tends to Show This Pattern Earlier Than Others
Research consistently shows that insulin resistance risk isn't distributed evenly across the population, and understanding where you fall on that map can help make sense of why this pattern showed up in your own results. Age is one of the more consistent factors — insulin sensitivity tends to decline gradually as people move through their thirties, forties, and beyond, partly due to natural changes in muscle mass and partly due to accumulating years of the lifestyle and metabolic factors discussed earlier. Ethnicity and ancestry also play a documented role: population studies, including data from the National Health and Nutrition Examination Survey (NHANES), have repeatedly found that South Asian, Hispanic/Latino, and Black adults in the U.S. tend to show insulin resistance at lower body mass index thresholds than white adults, meaning two people who look similarly "healthy weight" by conventional standards can carry meaningfully different underlying insulin resistance risk. Family history remains one of the single strongest predictors identified in genetic and twin studies — having a parent or sibling with type 2 diabetes roughly doubles or more the lifetime risk of developing insulin resistance, independent of shared lifestyle factors, pointing to a real inherited component in how efficiently a given person's cells respond to insulin in the first place. For women, hormonal transitions matter too: insulin sensitivity has been shown in multiple studies to decline somewhat during perimenopause and after menopause, likely related to the accompanying shift in estrogen levels and its downstream effects on fat distribution. None of these factors are things a person can control, which is exactly why they're useful to know — they help explain why insulin resistance can appear in people who are conscientious about diet and exercise, and why a family history of diabetes is one of the most reasonable justifications for asking a provider to check fasting insulin proactively, well before any symptoms or glucose changes appear.
Why the Gap Between Insulin and A1C Doesn't Stay Silent Forever
The compensation mechanism that keeps A1C normal while insulin climbs is powerful, but it isn't infinite. Beta cells operating at two or three times their baseline output are under sustained metabolic stress, and over years, a meaningful percentage of people begin to experience declining beta cell function — sometimes called beta cell "exhaustion" or "burnout" in less formal clinical language. When that happens, insulin output, which had been climbing for years to compensate, starts to plateau and can even begin falling, even as insulin resistance in the tissues themselves stays the same or continues to worsen. This is the turning point at which blood glucose finally starts drifting upward, first typically appearing as elevated post-meal (postprandial) glucose spikes, then as impaired fasting glucose, and eventually as a rising A1C — the exact number that, up until this point, had looked perfectly normal. This progression, from normal A1C with high insulin, to prediabetes, to type 2 diabetes, frequently unfolds over five, ten, or more years, which is part of why insulin resistance is often described as a slow-moving process rather than a sudden event — and why catching it at the high-insulin, normal-A1C stage represents a genuinely meaningful window for intervention, well before any diabetes diagnosis is remotely on the table.
Beyond Blood Sugar: Why Elevated Insulin Matters on Its Own
It's tempting to think of high insulin purely as an early warning sign for future diabetes, but research over the past two decades has made clear that chronically elevated insulin is not metabolically neutral in the meantime — it appears to carry its own direct consequences, independent of whether blood sugar itself ever becomes abnormal. Insulin is a growth-signaling hormone in addition to its role in glucose regulation, and sustained high levels have been associated in observational research with promoting fat storage (particularly visceral fat, creating something of a self-reinforcing cycle), influencing blood pressure regulation through effects on the kidneys and blood vessels, and altering lipid metabolism in ways that can raise triglycerides and lower protective HDL cholesterol. Hyperinsulinemia (the clinical term for chronically elevated insulin) is also one of the defining features of metabolic syndrome, a cluster of conditions — abdominal obesity, elevated blood pressure, high triglycerides, low HDL, and elevated fasting glucose — that together substantially raise long-term cardiovascular risk. Some research has also examined potential links between chronically elevated insulin and certain hormonal conditions, most notably PCOS in women, where high insulin is thought to directly stimulate excess androgen production from the ovaries. None of this is meant to be alarming for its own sake — it's meant to underscore why "my A1C is fine" isn't the same statement as "my metabolic health is fine" when insulin is elevated, and why the high-insulin, normal-A1C pattern deserves real attention on its own terms, not just as a diabetes-prediction tool.
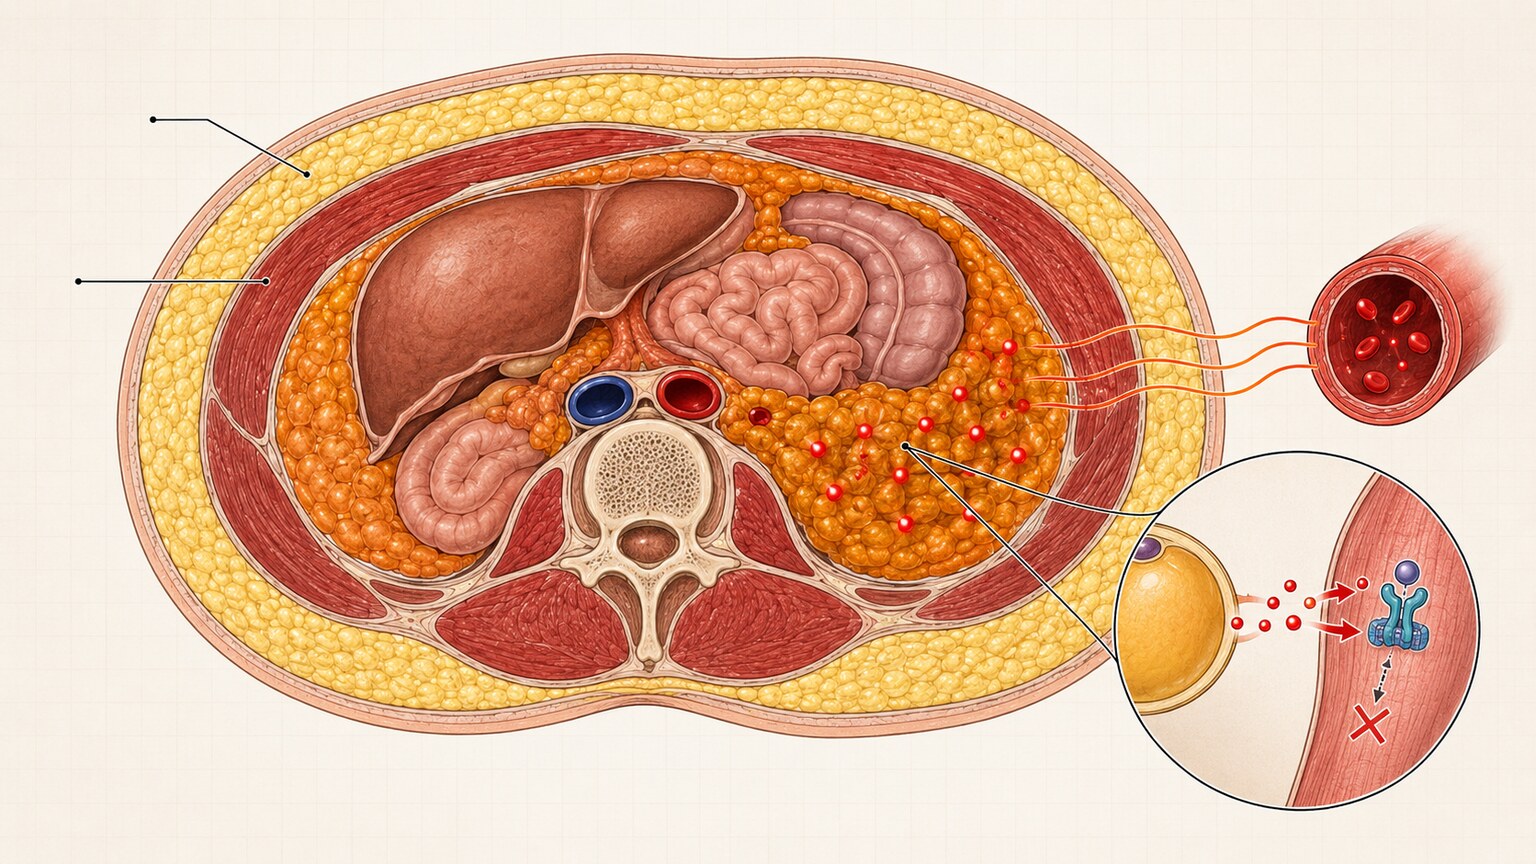
Figure 4. Visceral fat surrounding the abdominal organs releases inflammatory signals and free fatty acids that directly interfere with insulin's effect on cells.
How Reliable Is a Single Fasting Insulin Number?
One reasonable question to ask before drawing any conclusions from a single lab report is how much a single fasting insulin value can actually be trusted. Unlike glucose testing, which has been standardized across labs for decades, fasting insulin assays have historically shown more variability from one laboratory and testing method to another — different labs sometimes use different immunoassay techniques, and the "normal" reference range printed on a lab report can vary meaningfully depending on which method and population that lab validated its range against. This is one reason clinicians tend to favor looking at trends and combining insulin with other markers (fasting glucose, HOMA-IR, triglyceride-to-HDL ratio) rather than anchoring a decision on one isolated insulin number pulled from a single blood draw. Insulin also naturally fluctuates somewhat day to day depending on sleep quality the night before, recent physical activity, stress levels, and how strictly a true overnight fast was followed — a rushed eight-hour fast that technically still included a very late snack can meaningfully shift the result. None of this means a single elevated insulin reading should be dismissed; it means the most clinically useful approach, and the one most providers actually take, is to treat one elevated result as a prompt for a fuller workup and, where appropriate, a repeat test under carefully controlled fasting conditions, rather than as a standalone diagnosis in itself.
What the Diabetes Prevention Program Tells Us About This Exact Window
Some of the strongest evidence for why the high-insulin, normal-A1C stage matters comes from one of the most influential studies in modern metabolic medicine: the U.S. Diabetes Prevention Program (DPP), a large randomized controlled trial that followed thousands of adults already showing signs of impaired glucose regulation. The DPP compared an intensive lifestyle intervention — modest weight loss (around 7% of body weight) achieved through diet changes and roughly 150 minutes of weekly physical activity — against both a placebo group and a group treated with metformin. The lifestyle intervention reduced progression to type 2 diabetes by about 58% over roughly three years of follow-up, meaningfully outperforming metformin, which reduced progression by about 31% over the same period. Follow-up data from the same cohort, tracked for more than a decade afterward, showed that the benefit of the lifestyle intervention persisted well beyond the initial study period. While the DPP specifically enrolled people who already had impaired glucose tolerance rather than the earlier high-insulin, normal-A1C stage discussed throughout this article, the underlying mechanism its results point to is directly relevant here: the same interventions — modest weight loss, regular activity, dietary changes — that proved so effective at that later stage act on the exact same insulin-resistance pathway, and there is a reasonably strong physiological argument, echoed across smaller mechanistic studies, that intervening earlier, while beta cells are still compensating well rather than already struggling, tends to produce faster and more complete improvement.
What a High Insulin, Normal A1C Result Should Prompt You to Do
If you've gotten this exact combination back on a lab report, the most useful next step is usually a conversation with a healthcare provider about a fuller metabolic picture rather than a single repeat test. A fasting glucose test alongside the fasting insulin allows a HOMA-IR calculation, which gives a more complete sense of how much compensation is actually happening. Many providers will also look at triglycerides and HDL cholesterol together (sometimes expressed as a triglyceride-to-HDL ratio, which some research has suggested correlates reasonably well with insulin resistance), waist circumference as a practical proxy for visceral fat, and blood pressure — building a broader metabolic syndrome picture rather than relying on any one number in isolation. For some people, especially those with a strong family history of diabetes or PCOS symptoms, a provider might also consider an oral glucose tolerance test with paired insulin measurements, which can reveal a pattern (like elevated post-meal insulin with only mildly elevated post-meal glucose) that a fasting-only panel would miss entirely.
Everyday Signs People Sometimes Notice Before They Ever See the Lab Number
Because compensated insulin resistance doesn't move blood glucose out of range, it typically produces no symptoms that would send someone to a doctor on their own — this is exactly why the lab pattern, rather than how a person feels day to day, is usually what surfaces it first. That said, in hindsight, some people do recognize a handful of subtle patterns that fit the picture once they understand what's happening physiologically. Energy dips an hour or two after carbohydrate-heavy meals are one commonly reported pattern, plausibly related to the sharp rise and subsequent overcorrection in insulin that a resistant system produces in response to a large glucose load. Difficulty losing weight around the midsection despite consistent effort elsewhere is another pattern some people notice, consistent with insulin's role as a fat-storage signal and with visceral fat's own role in driving resistance — a cycle that can feel frustrating precisely because it reinforces itself. Skin changes are also worth knowing about: a condition called acanthosis nigricans, which shows up as darkened, slightly velvety patches of skin most often at the back of the neck, in the armpits, or in skin folds, is a well-documented visible marker specifically associated with high circulating insulin levels acting on skin cells, and its presence is sometimes what first prompts a clinician to order a fasting insulin test in the first place. None of these signs are diagnostic on their own, and plenty of people with confirmed insulin resistance notice none of them at all — but they're useful to be aware of, both because they can be a helpful prompt to ask for testing, and because recognizing them can make an otherwise abstract lab number feel more concretely connected to day-to-day experience.
The Encouraging Part: This Stage Is Highly Responsive to Change
If there's a genuinely reassuring aspect to catching insulin resistance at this stage — high insulin, normal A1C, no diabetes diagnosis anywhere in sight — it's that the research on reversibility at this point in the process is considerably more optimistic than it is once type 2 diabetes has already been diagnosed. Because beta cells at this stage are typically still working well (arguably working too well, which is the whole issue), rather than already showing significant functional decline, interventions that reduce the underlying resistance tend to produce measurable improvement relatively quickly. Regular exercise — both aerobic activity and resistance training — has been shown in numerous studies to improve insulin sensitivity, partly through the glucose uptake pathway in contracting muscle mentioned earlier, and partly through longer-term changes in muscle composition and mitochondrial function. Even a modest reduction in visceral fat, in the range of five to ten percent of body weight for people carrying excess weight, has been associated in clinical research with meaningful improvements in insulin sensitivity markers. Dietary changes that reduce the frequency and size of insulin spikes — emphasizing fiber, protein, and healthy fats while moderating refined carbohydrates and added sugar — are another well-supported lever. Prioritizing consistent, adequate sleep and managing chronic stress both address the cortisol pathway discussed earlier. None of these changes require extreme measures; the research consistently points toward sustainable, moderate changes producing real, measurable improvement in fasting insulin and HOMA-IR over a timeframe of months, not years — a meaningfully faster and more forgiving trajectory than what's typically required to reverse insulin resistance once it has already progressed to an abnormal A1C.

Figure 5. Meals built around fiber, protein, and healthy fats produce smaller, slower insulin responses than meals high in refined carbohydrates.
It's also worth saying plainly what this diagnosis is not: it is not type 2 diabetes, it is not prediabetes by A1C criteria, and it does not mean insulin injections or diabetes medication are on the immediate horizon for most people found at this stage. For some patients, particularly those with additional risk factors or a strong genetic predisposition, a provider may discuss medications like metformin, which improves insulin sensitivity directly, but lifestyle intervention is consistently the first-line approach at this stage across major clinical guidelines, precisely because it works this well this early.
Frequently Asked Questions
Is a high insulin, normal A1C result the same thing as prediabetes?
No. Prediabetes is diagnosed using A1C (typically 5.7% to 6.4%) or fasting glucose, not fasting insulin. A high insulin result with a normal A1C usually means your body is successfully compensating for insulin resistance and has not yet crossed into prediabetes territory on those standard measures — but it can be an earlier-stage warning sign that, without intervention, sometimes precedes a prediabetes diagnosis by several years.
Should I be worried, or is this actually a good sign that my body is compensating well?
It's reasonable to feel both at once. The fact that your A1C is normal genuinely means your blood sugar control is currently working, which is worth acknowledging. At the same time, the elevated insulin itself is a real signal worth acting on, since sustained high insulin has its own independent associations with cardiovascular and metabolic risk, and the compensation your pancreas is providing is not guaranteed to last indefinitely.
How often should fasting insulin be retested once it's found to be elevated?
There's no single universal interval, and this is best discussed with your provider based on your full risk profile, but many clinicians retest every three to six months after starting lifestyle changes to track whether HOMA-IR and fasting insulin are trending in the right direction, then space testing out further once values stabilize or improve.
Can insulin be high because of something other than insulin resistance?
Yes, though insulin resistance is by far the most common cause seen in adults with this pattern. Less commonly, elevated insulin can reflect certain medications, recent food intake if fasting instructions weren't followed closely, or, rarely, an insulin-producing tumor called an insulinoma — which is why unusual or unexpected results are always worth discussing directly with a healthcare provider rather than self-diagnosing.
Does having high insulin with a normal A1C mean I already have PCOS or will develop it?
No — this pattern is common in men and in women without PCOS, and having it does not mean a PCOS diagnosis is inevitable. It's simply that insulin resistance and PCOS are closely linked physiologically, particularly through insulin's effect on ovarian androgen production, so a woman with this lab pattern who is also experiencing irregular cycles or other PCOS symptoms should mention both to her provider together rather than treating them as unrelated findings.
If my insulin comes down with lifestyle changes, does that mean my risk has fully returned to normal?
A meaningful drop in fasting insulin and HOMA-IR is a genuinely good sign and generally tracks with reduced future diabetes and cardiovascular risk, but "risk returning to a specific person's individual baseline" isn't something a single lab value can fully certify on its own. Most providers use continued improvement in insulin, waist circumference, triglycerides, and blood pressure together as the more complete picture of whether the underlying insulin resistance is genuinely resolving.
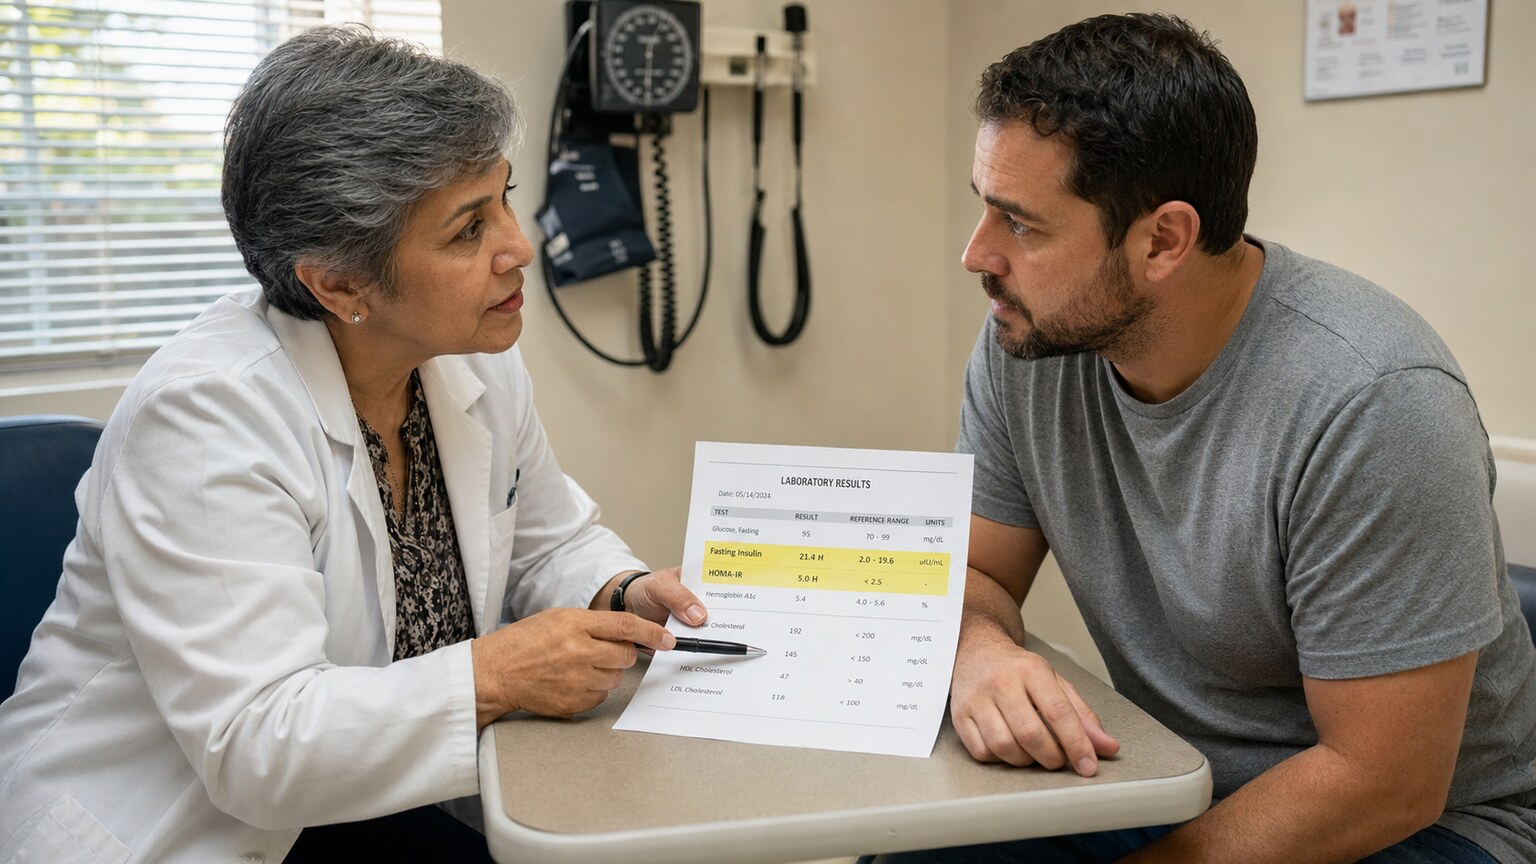
Figure 6. A HOMA-IR calculation, combined with waist circumference, triglycerides, and HDL, gives a fuller picture of metabolic risk than A1C alone.
Conclusion
A normal A1C alongside high fasting insulin is not a contradiction — it's exactly what compensated insulin resistance looks like on paper. Your A1C is telling you, accurately, that your blood sugar has stayed in range over the past few months. Your insulin level is telling you, just as accurately, how much extra work your pancreas has had to do to make that happen. Both numbers are correct; they're simply measuring two different stages of the same underlying process, and the insulin result is the one arriving first. Because this stage is typically both silent on standard testing and highly responsive to lifestyle changes, catching it here — rather than years later, once A1C has finally moved — represents a genuine opportunity rather than a diagnosis to be alarmed by. The most useful next step is rarely to panic over a single number; it's to bring the full picture (fasting insulin, fasting glucose, HOMA-IR, triglycerides, HDL, waist circumference) to a healthcare provider and build a plan from there.
It's worth sitting with one final reframe: a lab report that shows a normal A1C next to an elevated insulin value is, in a real sense, your body handing you a head start rather than a verdict. Most people who eventually receive a type 2 diabetes diagnosis spent years — sometimes a decade or more — moving through exactly this stage first, quietly compensating, with no lab abnormality loud enough to prompt a conversation. Having the insulin number in hand changes that. It turns a process that would otherwise stay invisible until glucose itself finally slips out of range into something visible, measurable, and, importantly, still early enough that the research on reversal is genuinely encouraging. Whatever combination of exercise, dietary change, sleep, stress management, or medical guidance ends up being right for your specific situation, the underlying message of this particular lab pattern is the same: your body is still winning this fight on its own, and the window to help it keep winning, without needing a diabetes diagnosis to force the issue, is open right now.
Still Not Sure What Your Results Mean?
Upload your labs and get a complete, visual, plain-language interpretation of every biomarker — delivered to your inbox in under 15 minutes.
Get My ReportThis article is for educational purposes only and does not constitute medical advice. Always consult your healthcare provider regarding your specific lab results.