
What Does the HOMA-IR Score Calculated From Insulin Mean?
HOMA-IR formally stands for Homeostatic Model Assessment of Insulin Resistance, and despite its rather technical-sounding, intimidating name, it's actually built from just two entirely ordinary numbers you may very well already have sitting on a recent lab report somewhere: fasting glucose and fasting insulin. Simply multiplying those two specific values together and then dividing the product by a fixed mathematical constant produces one single, combined score that estimates just how hard your own pancreas is currently having to work, entirely via insulin, in order to keep your overall blood sugar sitting comfortably within a genuinely normal range. A genuinely low score generally means your body needs relatively little circulating insulin to manage blood glucose efficiently and effectively under normal, everyday conditions. A steadily rising score, by contrast, means your body's own cells are becoming progressively more resistant to insulin's normal signaling effects over time, forcing your pancreas to pump out significantly more insulin than it otherwise would just to hold blood sugar reasonably steady — a compensatory response that can continue working effectively, quietly and invisibly, for years before glucose itself ever visibly budges on a standard fasting glucose test. Understanding exactly how this specific formula works is precisely what turns HOMA-IR from just another unfamiliar medical acronym into a genuinely useful, actionable early window into a person's overall metabolic health long before more obvious warning signs would otherwise appear.
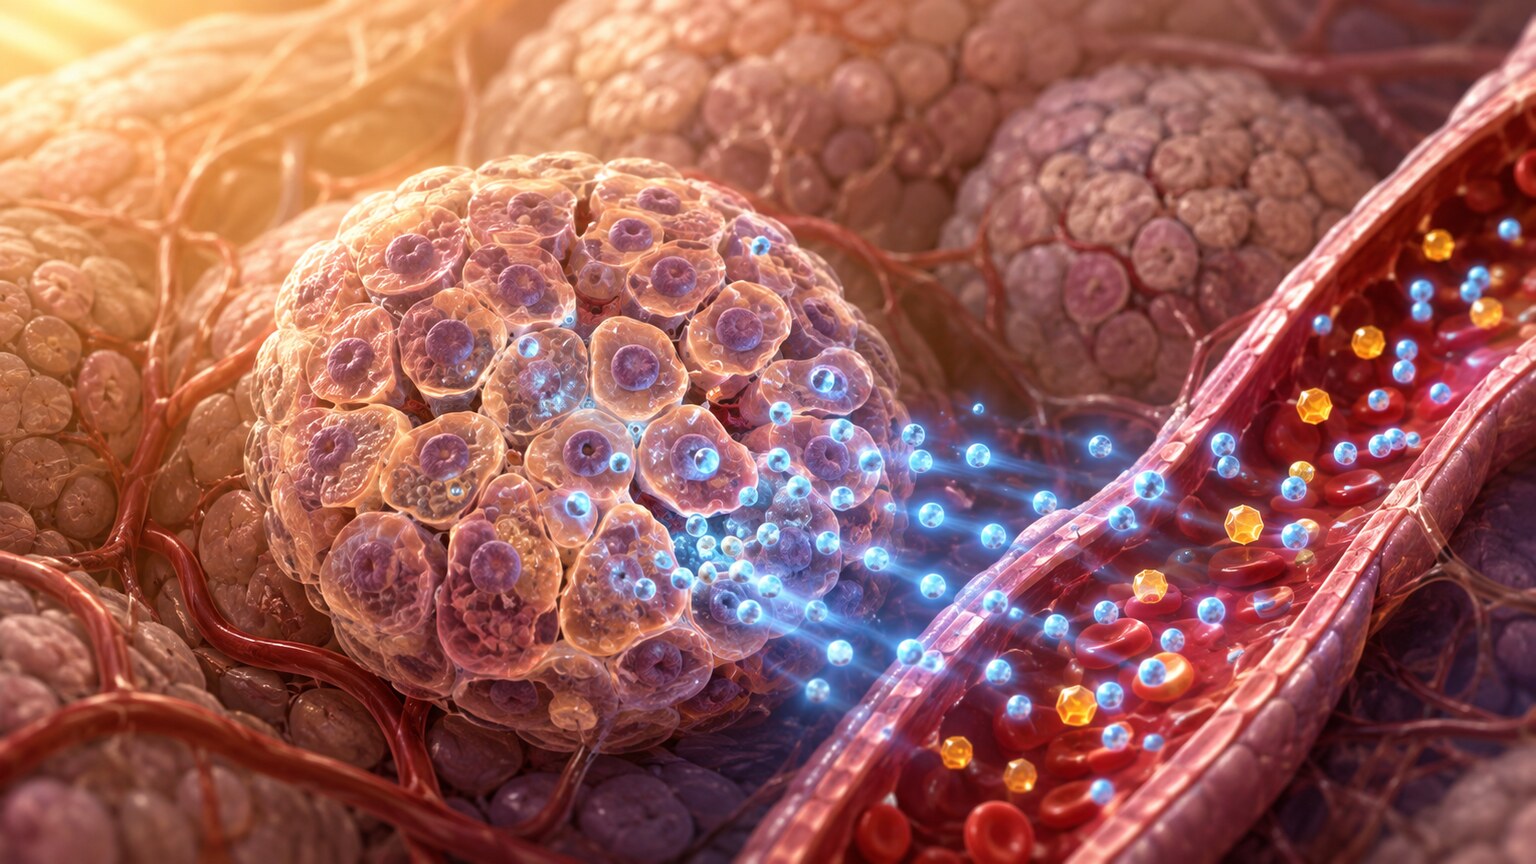
Figure 1. Beta cells within the pancreas release insulin in direct response to blood glucose, and HOMA-IR uses the fasting relationship between these two hormones to estimate how efficiently that signaling system is working.
Already have a HOMA-IR number from a recent test, but not sure if it's actually good or bad for you? Just plug it in and see instantly.
🧮 Try the Free CalculatorThe Formula, Step by Step
HOMA-IR is calculated using a deceptively simple equation:
HOMA-IR = (Fasting Glucose × Fasting Insulin) ÷ 405
Here, fasting glucose is measured in milligrams per deciliter (mg/dL) and fasting insulin in microunits per milliliter (µIU/mL), both drawn from the same blood sample after a period of fasting, typically at least 8 hours. The constant 405 is simply a mathematical scaling factor, originally derived from the underlying research that first developed this specific model back in the 1980s, chosen deliberately so that a genuinely healthy, non-insulin-resistant person's typical fasting values would consistently produce a resulting score conveniently close to a baseline value of 1.0. A concrete worked example makes this whole process considerably easier to follow: someone with a fasting glucose reading of 90 mg/dL and a fasting insulin reading of 8 µIU/mL would calculate their HOMA-IR as (90 × 8) ÷ 405 = 720 ÷ 405 ≈ 1.78, a resulting value that would generally be considered comfortably within a normal, healthy range for most adults.

Figure 2. Calculating HOMA-IR requires only the fasting glucose and fasting insulin values from the same blood draw, multiplied together and divided by the fixed constant 405.
Because HOMA-IR is calculated rather than directly measured, it doesn't require any additional blood draw beyond the two components already commonly tested — many labs and online calculators will compute it automatically once both fasting glucose and fasting insulin results are available, and some comprehensive metabolic panels now include the calculated HOMA-IR value directly on the printed report itself.
What Insulin Resistance Feels Like Before It Shows Up on a Test
Because insulin resistance can develop gradually over years while remaining invisible on standard glucose testing, it's worth understanding what subtle signs, if any, might accompany this process before a HOMA-IR score or eventual glucose abnormality ever appears on paper. Many people with developing insulin resistance report no noticeable symptoms at all for a long stretch of time, which is part of why the condition is considered so easy to miss without specific testing. When symptoms do eventually appear, they tend to be nonspecific and easy to attribute to other causes: persistent fatigue, particularly after meals, difficulty losing weight despite reasonable effort, and increased hunger or sugar cravings not long after eating are commonly reported, though none of these symptoms is specific enough to insulin resistance alone to serve as a reliable diagnostic signal on its own.
A visible skin change called acanthosis nigricans — dark, thickened, velvety patches of skin, most commonly appearing around the neck, armpits, or other skin folds — is one of the few physical signs directly and specifically linked to significant insulin resistance, thought to result from elevated insulin levels stimulating excess skin cell growth in these areas. When present, this skin finding can prompt a clinician to specifically investigate insulin resistance even before ordering any blood work, though its absence certainly doesn't rule out insulin resistance being present, since many people with meaningfully elevated HOMA-IR scores show no visible skin changes at all.
How HOMA-IR Relates to PCOS and Other Insulin-Resistance-Linked Conditions
Insulin resistance doesn't exist in isolation from the rest of the body's hormonal systems, and HOMA-IR has found particular clinical relevance in evaluating conditions where insulin resistance plays a central, well-documented role. Polycystic ovary syndrome (PCOS), a common hormonal condition affecting many women of reproductive age, is closely linked to insulin resistance in a substantial proportion of cases, and elevated insulin is thought to directly contribute to the excess androgen production characteristic of the condition, creating a self-reinforcing cycle between insulin resistance and hormonal imbalance. Because of this connection, HOMA-IR is sometimes used as part of a broader evaluation in women being assessed for PCOS, helping identify whether insulin resistance is a contributing factor worth specifically addressing as part of a treatment plan.
Non-alcoholic fatty liver disease (NAFLD), a condition involving fat accumulation in the liver not related to alcohol use, is another condition with a strong, well-established connection to insulin resistance, since insulin resistance promotes fat storage within liver cells through several interconnected metabolic pathways. Research has found HOMA-IR correlates with the presence and severity of fatty liver disease in many studied populations, making it one of several tools clinicians may consider when evaluating someone with suspected or confirmed NAFLD, alongside imaging and liver-specific blood tests.
Lifestyle Factors That Influence a Single Test Result
Beyond the fasting-duration issue already covered, several everyday lifestyle factors in the days leading up to a HOMA-IR test can meaningfully shift the result without reflecting any real underlying change in someone's baseline insulin sensitivity. Poor sleep, particularly a single night of significantly shortened or disrupted sleep, has been shown in research to acutely reduce insulin sensitivity the following day, meaning a test taken after a particularly bad night's sleep could show a temporarily elevated HOMA-IR that doesn't represent someone's true, typical metabolic baseline. Similarly, an unusually high-carbohydrate meal the evening before testing, even with an adequate fasting period observed afterward, has been associated in some research with modestly elevated fasting insulin the following morning compared to a more moderate prior meal.
Illness and infection, even relatively minor ones, can also transiently worsen insulin sensitivity as part of the body's broader inflammatory stress response, another reason clinicians generally prefer to avoid testing HOMA-IR during an active illness when a more representative, baseline result is the actual goal. None of these everyday factors invalidate HOMA-IR as a useful tool, but they're worth being aware of specifically because they explain why a single unusual result, especially one that doesn't fit a person's broader health picture, is often best interpreted with some caution and, when in doubt, confirmed with repeat testing under more typical conditions.
What a Trend Over Time Adds That a Single Score Can't
As with many calculated lab indices, a single HOMA-IR value captures only a snapshot, and tracking the score across multiple measurements over months or years often provides more genuinely useful information than any one result considered in isolation. A HOMA-IR that has been gradually climbing across several consecutive annual checkups, even while each individual value technically remains within a broadly normal range, can signal a meaningful underlying trend worth addressing proactively, well before any single value crosses into a level that would independently be flagged as concerning.
Conversely, someone actively working to improve metabolic health through diet, exercise, weight management, or medication can use a falling HOMA-IR trend over successive tests as objective, encouraging evidence that their efforts are producing a genuine, measurable physiological improvement — a kind of feedback that symptoms alone often can't reliably provide, given how gradually and subtly insulin resistance typically improves or worsens in the absence of dramatic symptoms in either direction.
Why This Particular Formula Was Developed
To understand why HOMA-IR takes the specific mathematical shape it does, it helps to understand what insulin resistance actually is at a cellular level. Insulin's core job is to signal cells throughout the body — particularly muscle, fat, and liver cells — to absorb glucose from the bloodstream. Insulin resistance describes a state where those cells respond less efficiently to insulin's signal than they should, requiring progressively more insulin to achieve the same glucose-lowering effect a smaller amount used to accomplish. This creates a specific, detectable pattern in fasting blood values: because the pancreas compensates for reduced cellular sensitivity by secreting more insulin, someone with developing insulin resistance often shows a fasting insulin level that's disproportionately high relative to their fasting glucose, even while glucose itself still looks completely normal.
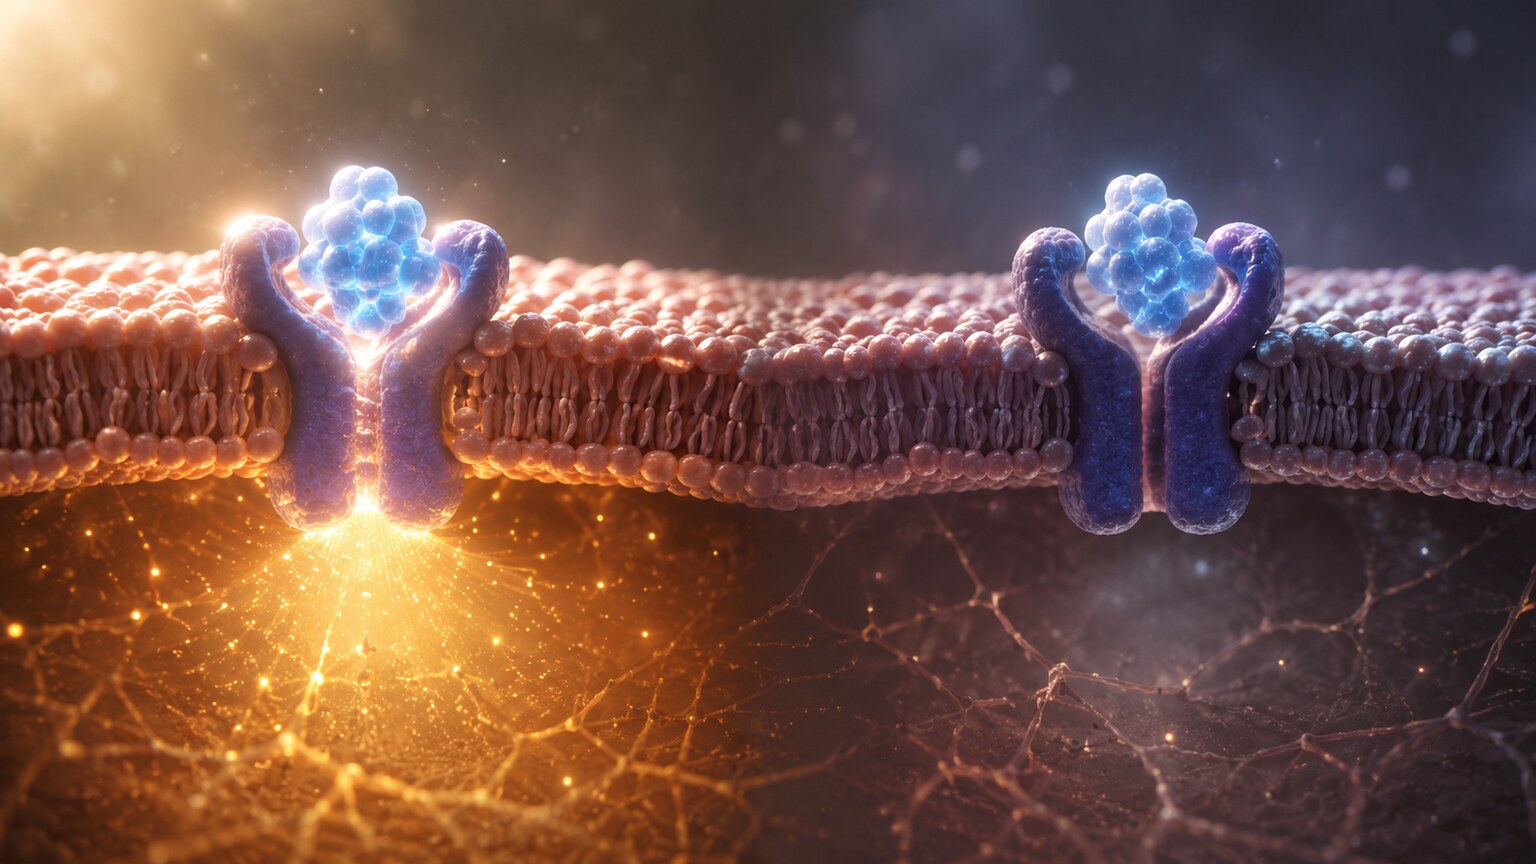
Figure 3. Insulin resistance occurs when muscle, fat, and liver cells respond less effectively to insulin's signal, requiring the pancreas to release progressively more insulin to achieve the same glucose-lowering effect.
HOMA-IR was specifically designed by researchers at Oxford in 1985 to capture exactly this glucose-insulin relationship using a single, easily obtainable fasting blood draw — a deliberately simplified alternative to far more elaborate, resource-intensive research methods for directly measuring insulin sensitivity, discussed further below. The multiplication of glucose and insulin together, rather than looking at either value in isolation, is the mathematical core of the model: it captures the specific interaction between the two hormones — how much insulin it's taking to hold a given glucose level steady — rather than treating each number as an independent, unrelated data point.
What a Rising Score Actually Reveals
The real clinical value of HOMA-IR lies in what it can reveal before standard glucose testing shows anything abnormal at all. Insulin resistance typically develops gradually, over years, and the body's compensatory response — secreting more insulin — is often remarkably effective at keeping fasting glucose within a completely normal range for a long time, sometimes for a decade or more, even as the underlying resistance steadily worsens. This practical reality means a standard fasting glucose test result, or even a hemoglobin A1c test specifically reflecting average blood sugar over several recent months, can continue looking entirely reassuring and unremarkable while HOMA-IR, by specifically factoring in the elevated insulin required to actively maintain that seemingly normal glucose level, already reveals a rising, genuinely concerning underlying trend that glucose alone simply cannot show.
This specific timing advantage is precisely why HOMA-IR has become such a genuinely valuable research and clinical tool for identifying developing insulin resistance at a considerably earlier stage than glucose-based testing alone typically allows — effectively catching the body's ongoing compensation phase itself, rather than passively waiting for that compensation to eventually fail and glucose to visibly start climbing upward, which is the later point at which prediabetes and eventually type 2 diabetes actually become formally diagnosable through standard glucose-based criteria.
Interpreting a HOMA-IR Result

Figure 4. Because HOMA-IR depends entirely on the fasting relationship between glucose and insulin, an inadequate fast before the blood draw can meaningfully distort the resulting score.
There's no single, universally standardized cutoff for HOMA-IR the way there is for fasting glucose, since normal ranges vary somewhat depending on the specific population studied, the assay method used to measure insulin, and even ethnicity-related differences in typical insulin sensitivity found in some research. That said, a commonly cited general guideline considers a HOMA-IR below roughly 1.0 to represent optimal insulin sensitivity, values between about 1.0 and 1.9 as a normal, unremarkable range for most adults, and values of 2.0 or higher as suggestive of some degree of developing insulin resistance, with scores climbing further, often cited above 2.9, considered more strongly indicative of significant resistance.
These thresholds should be treated as general reference points rather than rigid diagnostic cutoffs, since HOMA-IR is more often used as a research and risk-stratification tool than as a formal, standalone diagnostic criterion the way fasting glucose or A1c are for diabetes itself. In everyday clinical use, a rising or elevated HOMA-IR is generally interpreted as one meaningful piece of a broader metabolic picture — considered alongside weight, waist circumference, blood pressure, triglycerides, HDL cholesterol, and family history — rather than a number that, on its own, triggers an automatic diagnosis.
What "Prediabetes" and HOMA-IR Actually Have in Common — and Where They Differ
It's worth directly clarifying how HOMA-IR relates to prediabetes, a formally recognized diagnostic category defined using standard glucose or A1c criteria, since the two concepts are related but not interchangeable. Prediabetes is diagnosed once fasting glucose, an oral glucose tolerance test result, or A1c crosses specific, standardized numeric thresholds — meaning by the time someone meets formal prediabetes criteria, their pancreas's compensatory insulin response has typically already begun to fall short of fully covering their insulin resistance, allowing glucose itself to start drifting upward.
An elevated HOMA-IR, by contrast, often appears well before that point, during the phase when the pancreas is still successfully compensating and glucose remains entirely normal. This distinction is exactly why HOMA-IR is sometimes described as detecting insulin resistance at an earlier stage than prediabetes criteria can — not because it's measuring a fundamentally different underlying process, but because it's specifically designed to capture the compensatory insulin response itself, rather than waiting for that compensation to eventually become inadequate and glucose to rise as a result. Someone can have a meaningfully elevated HOMA-IR while still falling well short of meeting formal prediabetes criteria, and understanding this distinction is part of why some clinicians and researchers advocate for wider use of HOMA-IR or similar tools specifically as an earlier warning system, ahead of the point where formal diabetes-spectrum diagnostic criteria would first apply.
Why Fasting Conditions Matter So Much for This Test
Because the entire HOMA-IR formula depends on both glucose and insulin being measured under stable, fasting conditions, inadequate fasting before the blood draw is one of the most common sources of a misleading result. Eating or drinking anything other than water in the hours before the test causes both glucose and insulin to rise as part of the body's completely normal digestive response, and because this post-meal rise doesn't reflect the same steady-state relationship the formula was designed to capture, a non-fasting sample can produce a HOMA-IR value that looks artificially elevated without reflecting any genuine underlying insulin resistance.
Most labs recommend fasting for at least 8 hours, and some protocols recommend closer to 10 to 12 hours, before this specific test, water permitted throughout. Certain other factors close to the test — acute illness, significant recent physical stress, or very recent intense exercise — can also transiently shift insulin levels independent of someone's baseline insulin sensitivity, which is part of why a single unusual HOMA-IR result, particularly one that doesn't fit the rest of a person's clinical picture, is often worth repeating under more carefully controlled conditions before being treated as a firm, reliable finding.
HOMA-IR Versus More Direct Measures of Insulin Sensitivity
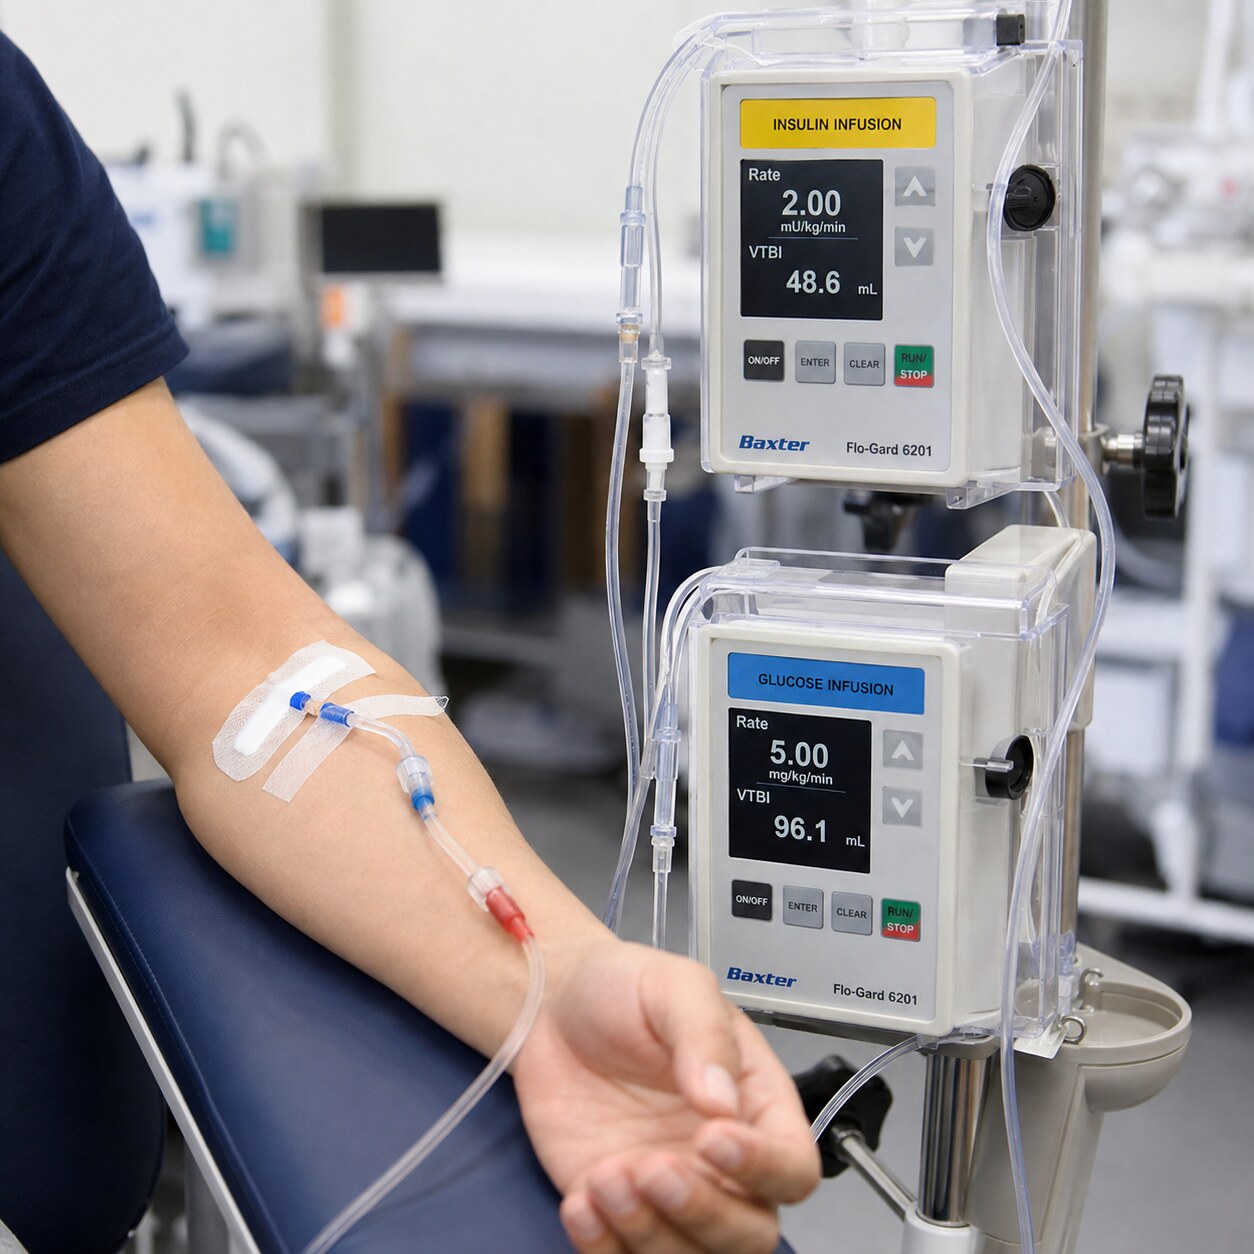
Figure 5. The hyperinsulinemic-euglycemic clamp, involving continuous intravenous insulin and glucose infusion over several hours, remains the gold-standard research method for directly measuring insulin sensitivity, far too resource-intensive for routine clinical use.
HOMA-IR was deliberately designed as a practical, simplified alternative to far more rigorous but impractical research techniques for measuring insulin sensitivity directly. The gold-standard method, called the hyperinsulinemic-euglycemic clamp, involves continuously infusing insulin intravenously at a fixed rate while simultaneously infusing glucose at whatever rate is needed to keep blood sugar perfectly steady, typically over two to four hours, with the amount of glucose required serving as a direct, precise measure of how sensitive the body is to insulin. This method is considered extremely accurate but is also expensive, time-consuming, technically demanding to perform correctly, and entirely impractical for routine clinical screening — reserved almost exclusively for dedicated research studies.
HOMA-IR, requiring nothing more than a single fasting blood draw, sacrifices some precision compared to the clamp technique in exchange for enormous practicality, and validation studies comparing the two methods have generally found a reasonably strong correlation between them across large study populations, even though HOMA-IR is understood to be a less precise estimate for any single individual than the clamp method would provide. This deliberate tradeoff — knowingly accepting somewhat reduced individual precision in direct exchange for a genuinely simple, practical test that's actually feasible to run routinely on a large scale — is exactly why HOMA-IR, despite its acknowledged limitations, has become so widely used in both academic research and everyday routine clinical practice, while the far more elaborate clamp technique remains confined almost entirely to specialized, well-funded research settings.
How Reference Labs Report and Standardize This Value
Because HOMA-IR is a calculated rather than a directly assayed value, how it actually shows up on a lab report can vary somewhat between different laboratories and healthcare systems. Some labs compute and print the HOMA-IR value automatically whenever both fasting glucose and fasting insulin are ordered together on the same requisition, listing it as its own line item alongside the two raw component values. Other labs report only the raw glucose and insulin numbers, leaving the calculation itself to be performed manually by the ordering clinician or through a separate online calculator, meaning the same underlying blood draw can appear quite differently formatted depending on which lab processed it.
When a HOMA-IR value is calculated by a third party — an online tool, a fitness or health app, or a calculator like the one referenced earlier in this article — it's worth double-checking that the correct units were used for both glucose and insulin, since entering values in the wrong units (for instance, insulin reported in pmol/L rather than µIU/mL, a unit conversion issue that occasionally arises internationally) can produce a wildly inaccurate result despite using the exact correct underlying formula.
Alternative Formulas Built on the Same Basic Idea
HOMA-IR isn't the only calculated index built from fasting glucose and insulin, and understanding a couple of the alternatives helps clarify what makes HOMA-IR's specific approach distinctive. The Quantitative Insulin Sensitivity Check Index (QUICKI) uses the same two input values but applies a different mathematical transformation — taking the logarithm of both fasting glucose and fasting insulin before combining them — a modification some researchers have found produces a slightly more statistically stable relationship with directly measured insulin sensitivity, particularly at the healthier end of the spectrum, though QUICKI has seen considerably less widespread clinical adoption than HOMA-IR despite this technical advantage.
The Matsuda Index takes a more elaborate approach entirely, incorporating glucose and insulin values measured at multiple time points during an oral glucose tolerance test rather than relying on a single fasting measurement alone, capturing how the body responds to an actual glucose challenge rather than just its baseline fasting state. This added complexity generally improves accuracy compared to a fasting-only calculation like HOMA-IR, but it also requires the more involved oral glucose tolerance test procedure — drinking a standardized glucose solution and having blood drawn at several intervals afterward — making it considerably less convenient for routine, everyday clinical use. HOMA-IR's continued popularity, despite these more sophisticated alternatives existing, comes down largely to the same practical tradeoff discussed throughout this article: it requires only a single fasting blood draw, making it dramatically easier to obtain than any of these more elaborate alternatives, even at some cost to precision.
The Original Research Behind the Formula
Understanding a bit more about where HOMA-IR actually came from adds useful context to how it should be interpreted today. The model was first described in a landmark 1985 paper by a research team at Oxford University, led by David Matthews, who developed the mathematical relationship by comparing fasting glucose and insulin measurements against results from the hyperinsulinemic-euglycemic clamp technique in a study population, working out a formula that could approximate the clamp's more elaborate direct measurement using nothing more than values obtainable from a single fasting blood sample.
In the decades since that original publication, HOMA-IR has been validated, refined, and applied across an enormous number of subsequent research studies spanning many different populations, ages, and health conditions, cementing its place as one of the most widely used and widely cited tools in metabolic and diabetes research specifically because of this extensive body of supporting validation work — even as newer, more mathematically sophisticated models have since been developed. This long research history is part of why HOMA-IR, despite being a comparatively simple formula developed decades ago, remains a trusted, well-understood reference point rather than being treated as an outdated or superseded method.
Populations Where HOMA-IR Requires Extra Interpretive Care
Certain groups of people warrant particular caution when interpreting a HOMA-IR result, since the formula's underlying assumptions don't hold equally well across every population. Pregnant women experience substantial, expected shifts in insulin sensitivity as pregnancy progresses, particularly during the second and third trimesters, when placental hormones deliberately induce a degree of insulin resistance to help ensure adequate glucose supply reaches the developing fetus — a normal, expected physiological adaptation rather than a sign of metabolic dysfunction, meaning standard non-pregnant HOMA-IR reference ranges don't meaningfully apply during this period.
Children and adolescents also require separate consideration, since insulin sensitivity naturally shifts during puberty, with a well-documented temporary increase in insulin resistance occurring during the pubertal growth period itself, independent of any underlying metabolic problem, before typically improving again as puberty completes. People with significant liver disease represent another group requiring caution, since the liver plays a central, direct role in both glucose regulation and insulin clearance from the bloodstream, meaning significant liver dysfunction can distort the fasting glucose-insulin relationship the HOMA-IR formula assumes, independent of true peripheral insulin resistance in muscle and fat tissue.
Known Limitations Worth Understanding
Beyond the fasting-condition sensitivity already discussed, HOMA-IR carries a few other well-recognized limitations. The formula assumes a fairly simplified model of how the pancreas and liver interact to regulate glucose, and it doesn't fully account for certain more complex physiological situations — including significant liver disease, which can independently alter both glucose and insulin handling in ways the basic formula wasn't designed to capture, or conditions involving significantly impaired insulin production itself (as opposed to impaired insulin sensitivity), where a low insulin level might reflect a failing pancreas rather than genuinely excellent insulin sensitivity.
Insulin measurement itself also isn't perfectly standardized across different laboratories and assay platforms, meaning the exact numeric insulin value — and therefore the resulting HOMA-IR score — can vary somewhat depending on which specific lab and testing method was used, a real source of result-to-result variability that's less of an issue for more standardized tests like glucose. This is part of why comparing a HOMA-IR result against a broad, general reference range, and watching the overall trend over time from the same lab, tends to be more clinically useful than treating any single result as a precise, universally comparable number.
Where HOMA-IR Fits Alongside Other Metabolic Risk Markers
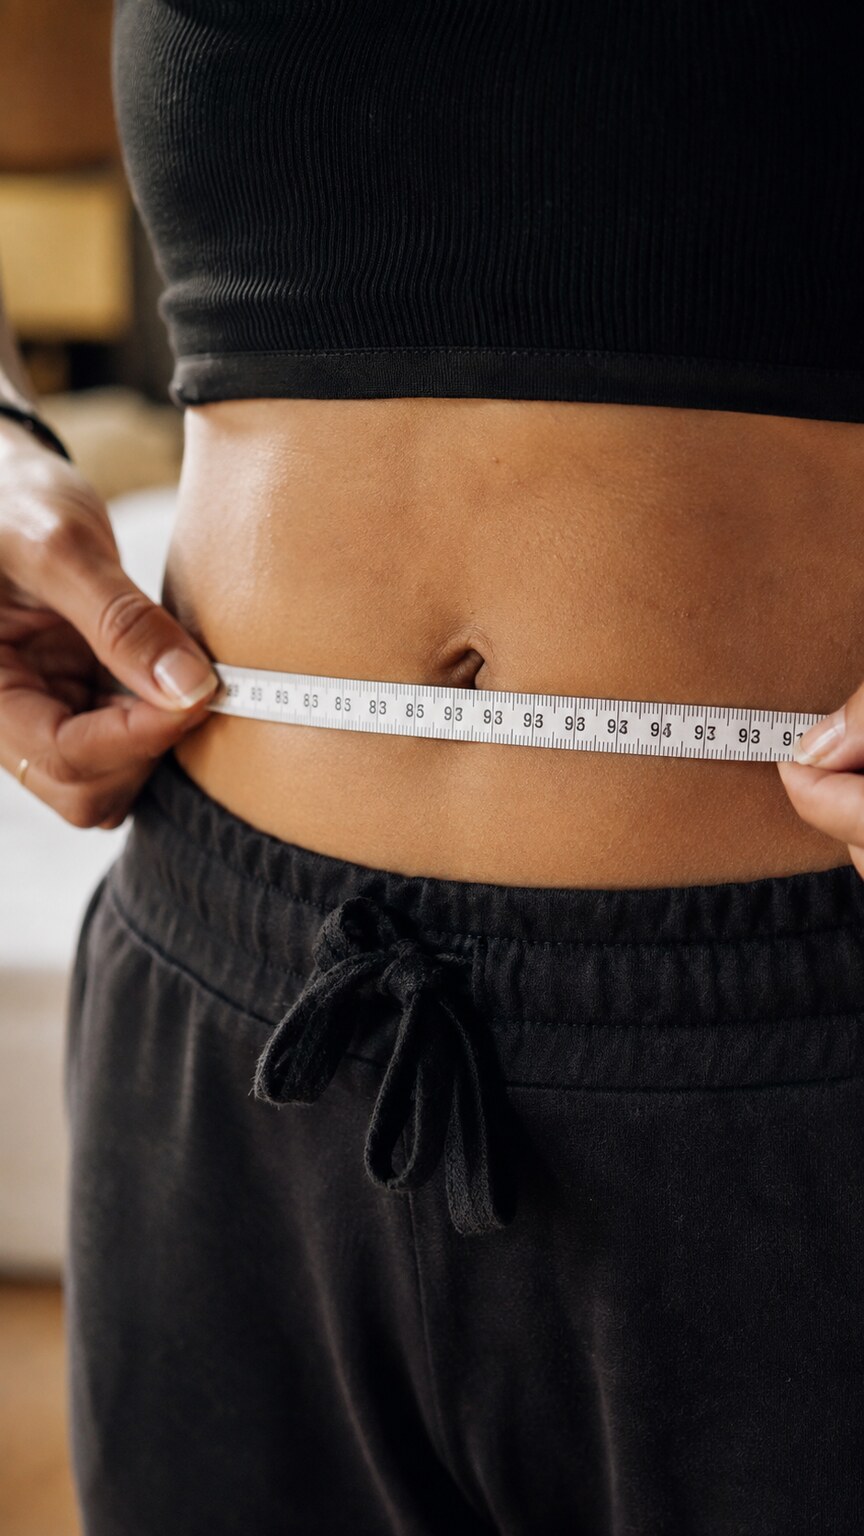
Figure 6. Waist circumference, along with blood pressure, triglycerides, and HDL cholesterol, is typically considered alongside HOMA-IR rather than relying on the calculated score in isolation.
HOMA-IR rarely stands alone in a genuinely thorough metabolic assessment, and understanding what typically accompanies it helps clarify its actual role. Waist circumference, a simple but surprisingly informative measurement, correlates closely with visceral fat — fat stored around internal organs rather than just beneath the skin — which is itself strongly linked to insulin resistance through several biological pathways, including the release of inflammatory signaling molecules from visceral fat tissue that directly interfere with normal insulin signaling. Blood pressure, triglycerides, and HDL cholesterol round out what's sometimes referred to informally as a metabolic risk cluster, since insulin resistance, central obesity, elevated blood pressure, and an unfavorable lipid pattern frequently occur together, reinforcing and compounding one another rather than existing as isolated, unrelated findings.
When several of these markers point in the same concerning direction together, the overall clinical picture carries considerably more weight than any single value, including HOMA-IR, would on its own — which is exactly the broader context that turns a calculated insulin-resistance score from an interesting standalone number into a genuinely actionable piece of a person's overall metabolic health assessment.
How to Talk to a Healthcare Provider About This Result
If a HOMA-IR result comes back elevated, or trending in a concerning direction over time, the most useful thing to bring into a conversation with a healthcare provider isn't necessarily the raw number itself, but a genuine willingness to discuss the broader lifestyle and family-history context that gives that number real meaning. Mentioning relevant details — a family history of type 2 diabetes, recent weight changes, typical dietary patterns, physical activity levels, and sleep quality — helps a clinician interpret an elevated HOMA-IR within the fuller picture it was always meant to be read alongside, rather than reacting to an isolated number without that surrounding context.
It's also reasonable to ask directly whether repeat testing under more carefully controlled fasting conditions would be useful, particularly if the result seems inconsistent with the rest of a person's known health picture, or whether additional testing — including a full lipid panel, blood pressure check, or waist circumference measurement — would help build a more complete metabolic risk assessment rather than relying on HOMA-IR in isolation.
Frequently Asked Questions
Can I calculate my own HOMA-IR if I already have both lab values?
Yes, if you have both a fasting glucose (in mg/dL) and fasting insulin (in µIU/mL) from the same blood draw, you can apply the formula yourself: multiply the two values together and divide by 405. Many labs and calculators will also do this automatically.
Why isn't HOMA-IR used to formally diagnose diabetes?
HOMA-IR is more commonly used as a research and risk-assessment tool than a formal diagnostic criterion, since it lacks a single universally standardized cutoff and isn't as precise as direct insulin-sensitivity testing methods. Diabetes diagnosis relies on standardized glucose and A1c criteria instead.
Can HOMA-IR be normal even with a family history of diabetes?
Yes. Family history increases risk but doesn't guarantee insulin resistance is already present at any given point in time. A normal HOMA-IR reflects current insulin sensitivity, though ongoing monitoring may still be reasonable given elevated background risk.
Does weight loss improve HOMA-IR?
Research has generally found that weight loss, particularly reduction in visceral fat, is associated with improved insulin sensitivity and correspondingly lower HOMA-IR scores over time, though the degree of improvement varies between individuals and depends on multiple factors beyond weight alone.
Is HOMA-IR the same test as fasting insulin alone?
No. Fasting insulin on its own is just one of the two components HOMA-IR combines. HOMA-IR specifically captures the relationship between insulin and glucose together, which can reveal insulin resistance patterns that looking at either value alone might miss.
Can exercise alone lower HOMA-IR without weight loss?
Research has found that regular physical activity, particularly resistance and aerobic exercise, can improve insulin sensitivity through mechanisms independent of weight change, including increased glucose uptake by muscle tissue during and after exercise, meaning some improvement in HOMA-IR is possible even without significant weight loss.
What Happens If HOMA-IR Comes Back Elevated
An elevated HOMA-IR result, confirmed under proper fasting conditions and considered alongside the rest of a person's health picture, generally leads to a conversation about lifestyle-focused interventions before any medication is typically considered, since insulin sensitivity has been consistently shown in research to respond meaningfully to changes in diet, physical activity, sleep, and body composition. Dietary approaches that reduce rapid blood sugar spikes, regular physical activity that increases muscle glucose uptake, adequate sleep, and, where relevant, gradual weight reduction focused particularly on visceral fat are the interventions most consistently associated with measurable improvement in insulin sensitivity across published research.
In some cases, particularly when insulin resistance is more pronounced or accompanied by other risk factors, a clinician may also discuss medications already used for insulin resistance and related conditions, though this decision depends heavily on the full clinical picture rather than the HOMA-IR value in isolation. Regardless of the specific approach chosen, repeat HOMA-IR testing after a meaningful period of intervention — often several months — provides an objective way to gauge whether the chosen approach is producing a genuine, measurable improvement in the underlying insulin resistance the score was designed to detect.
Conclusion
HOMA-IR takes two numbers many people already have on a recent lab report — fasting glucose and fasting insulin — and combines them through a simple formula into a single estimate of how hard the pancreas is working to keep blood sugar under control. Because insulin resistance often develops silently for years while standard glucose testing still looks completely normal, this calculated score can reveal a meaningful metabolic shift well before glucose itself ever moves out of range. It isn't a perfect, universally standardized, or formally diagnostic number, and it depends heavily on proper fasting conditions and thoughtful interpretation to be genuinely meaningful, but understood correctly, alongside the rest of a person's broader metabolic picture, HOMA-IR turns two routine, already-available lab values into a genuinely earlier, more informative warning system than either fasting glucose or fasting insulin ever could offer entirely on its own.
Still Not Sure What Your Results Mean?
Upload your labs and get a complete, visual, plain-language interpretation of every biomarker — delivered to your inbox in under 15 minutes.
Get My ReportThis article is for educational purposes only and does not constitute medical advice. Always consult your healthcare provider regarding your specific lab results.