
What Does My Quest Diagnostics / Labcorp Result Actually Mean?
Quest Diagnostics and Labcorp aren't just two lab companies among many — together they run the two largest commercial laboratory networks in the country, which means there's a very good chance the confusing PDF or portal page you're staring at right now came from one of them. The good news is that once you know what to actually look for, both reports follow the same underlying anatomy, even though the layout, terminology, and even the "normal" ranges printed on the page can differ meaningfully between the two. This article walks through exactly what each section of your report means, why the identical test can show a different reference range depending on which of the two networks ran it, what those confusing "performing lab" lines are actually telling you, and — because it changed very recently — what it means that both companies now build their own AI explanation tools directly into their apps.
The Anatomy of Either Report — What Every Section Actually Means
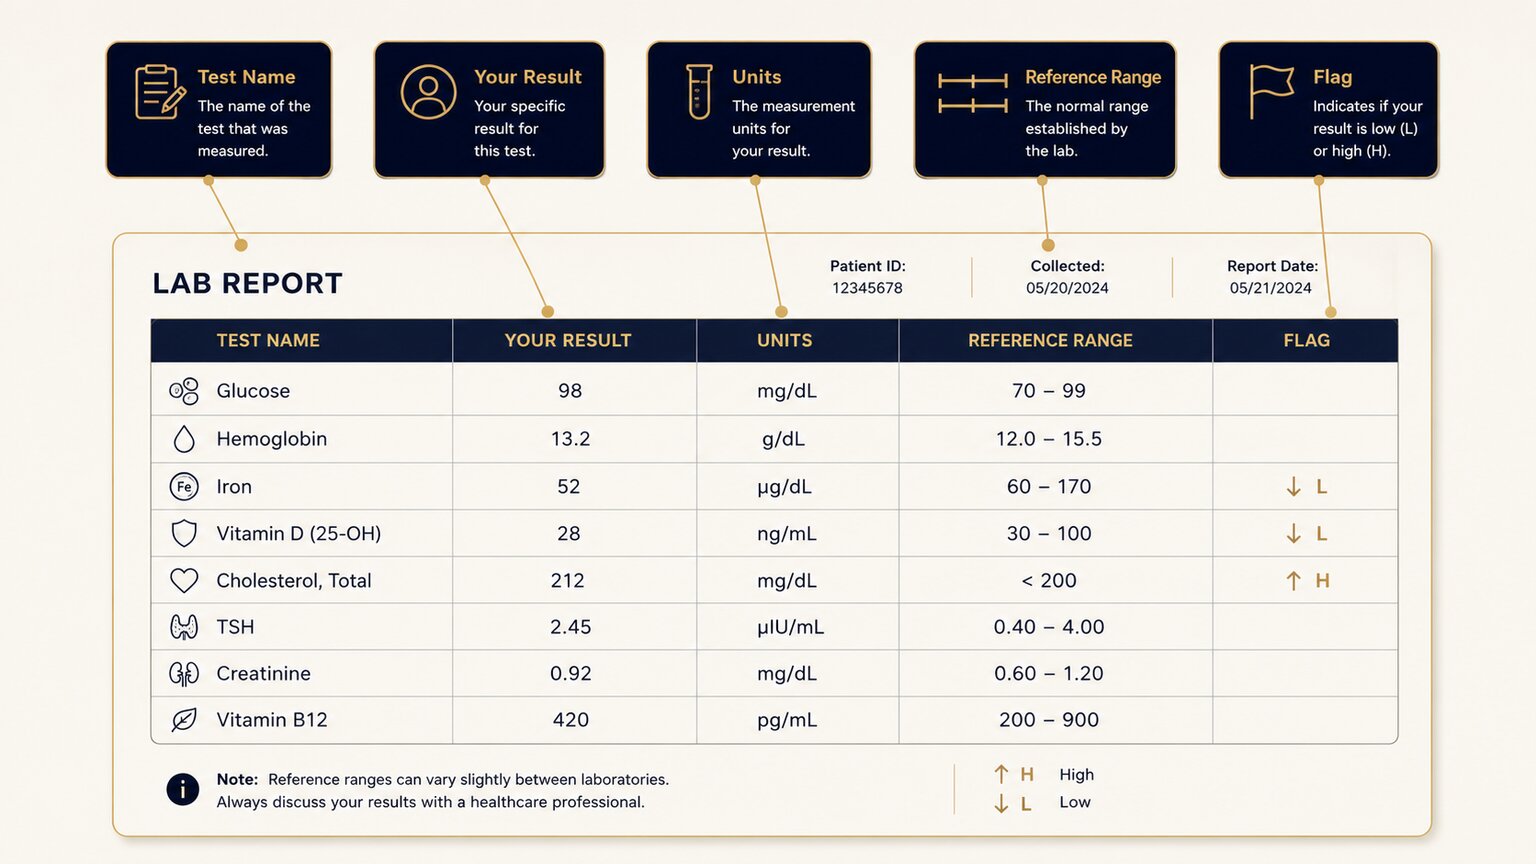
Strip away the branding and both a Quest and a Labcorp report are built from the same handful of columns, repeated once for every value on your panel. Learning to read one column at a time makes the whole page far less overwhelming than trying to absorb it all at once.
- Test name — the specific thing being measured, sometimes written in full ("Hemoglobin A1c") and sometimes as an abbreviation ("HbA1c") depending on the panel.
- Your result — the actual number or value your sample produced, usually the boldest or most prominent figure in the row.
- Units — what that number is measured in (mg/dL, mmol/L, %, and so on) — always read the number together with its unit, since the same value in different units can mean completely different things.
- Reference range or reference interval — the window the lab considers typical for that test, usually printed directly beside or below your result.
- Flag — a short marker (like H or L) that only appears when your result falls outside that printed range.
- Specimen and collection details — when your sample was drawn, when it was received by the lab, and when the result was finalized, which matters most for tests that are time-sensitive or require fasting.
- Performing lab — the specific facility that actually ran the test, which is not always the same location where your blood was drawn (more on this below).
Quest vs. Labcorp: The Terminology Differences Worth Knowing
The two networks describe the same concepts with slightly different words, and knowing the translation ahead of time removes a surprising amount of confusion. Quest reports commonly label the "normal" window a reference range, while Labcorp reports specifically tend to use the term reference interval for the identical concept — different words, same meaning. Both networks use H and L flags for results above or below that window. Labcorp reports go a step further with an additional A flag for results considered abnormal in a broader sense, and both networks use a doubled flag — HH or LL — to mark a critical result serious enough to trigger an immediate call to your provider rather than routine review. The two companies also name their patient-facing apps differently: Quest's is called MyQuest, while Labcorp splits its access between the Labcorp Patient web portal and the MyLabcorp mobile app.
| Concept | Quest Diagnostics | Labcorp |
|---|---|---|
| "Normal" window | Reference range | Reference interval |
| Above/below range | H / L | H / L |
| Broadly abnormal | Not commonly used | A |
| Critical value | HH / LL | HH / LL |
| Patient app/portal | MyQuest | Labcorp Patient (web) / MyLabcorp (app) |
Why the Exact Same Test Can Show a Different "Normal" Range at Each Lab
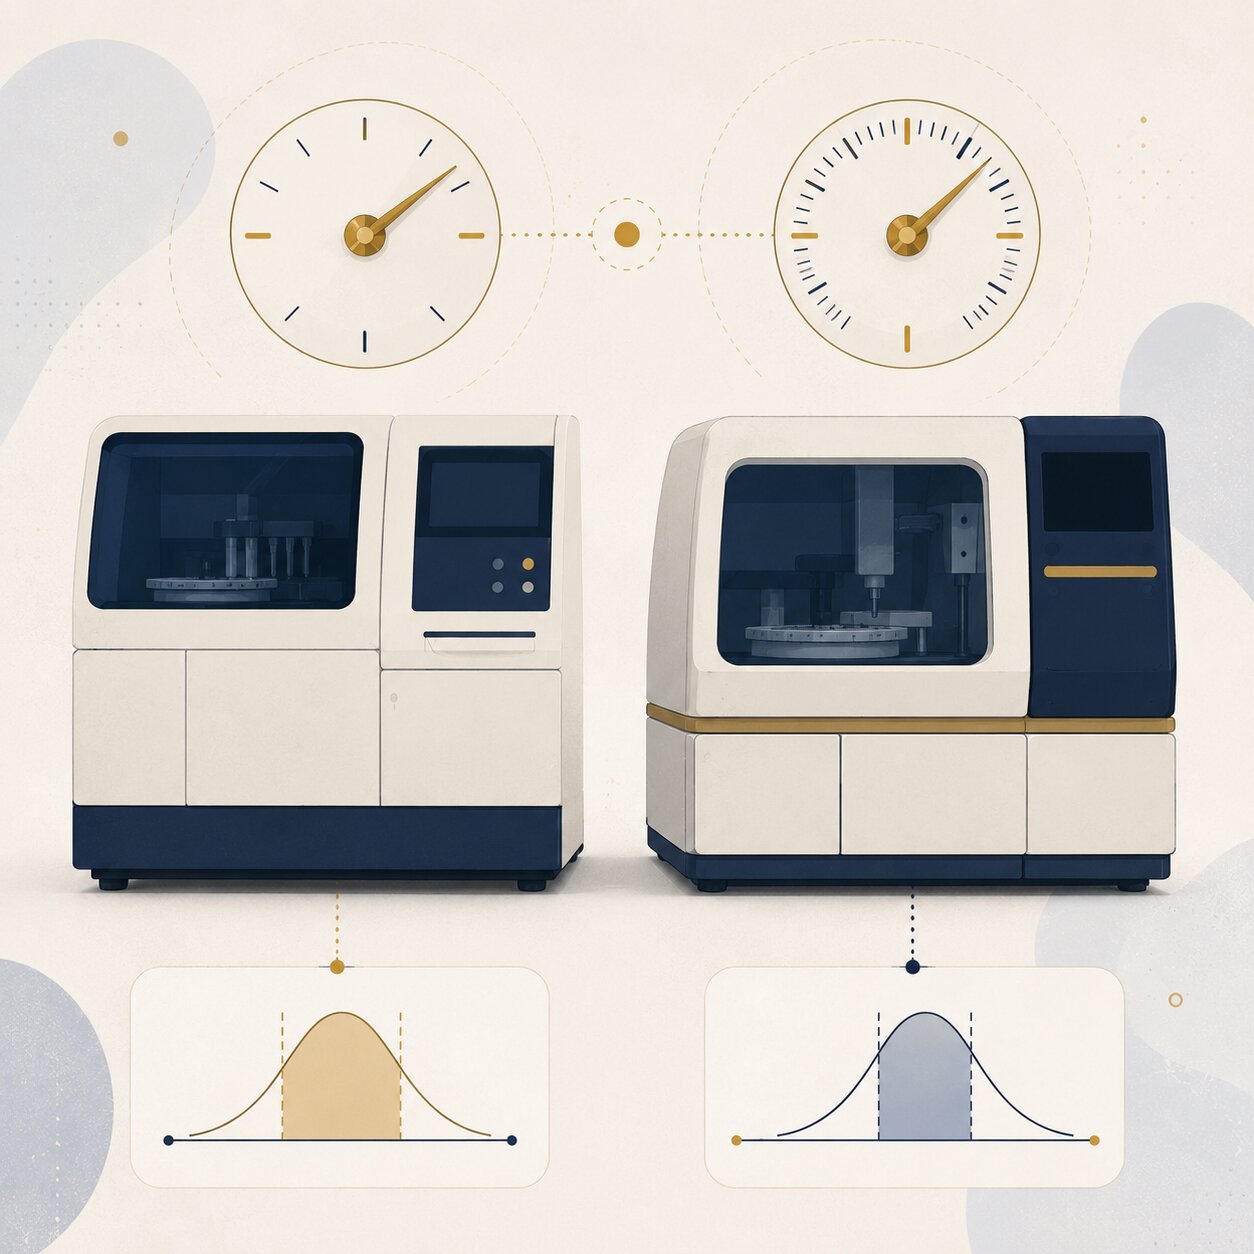
This is the single most common source of genuine confusion between the two networks, and it has a real technical explanation rather than being an inconsistency or a mistake. Labs don't all measure every biomarker the same way — one network might run a hormone panel using an immunoassay method, while another uses mass spectrometry or a differently calibrated version of the same underlying technique. Different equipment, different reagents, and different reference populations used to establish "normal" in the first place can all shift the printed range slightly, or in some cases meaningfully. Testosterone testing is a commonly cited example: the two networks have historically published noticeably different normal ranges for the same hormone in men, not because one of them is wrong, but because their assay methods and calibration aren't identical. The practical takeaway is simple but important: never compare a result from one network against the reference range printed on a report from the other. Always read your number against the range printed on that specific report, from that specific lab, on that specific day.
Both Networks Now Build Their Own AI Explanation Tools — Here's What That Covers
As of early 2026, this space changed in a way worth knowing about directly. Quest Diagnostics launched Quest AI Companion inside the MyQuest app, built on Google's Gemini models through a partnership announced in 2025 — it can define terminology, tell you whether a value is high or low, analyze trends across as much as five years of your own historical results, and help you draft sharper questions for your doctor, while stating clearly that it's educational and not a substitute for medical advice. Labcorp's MyLabcorp app has moved in a similar direction, offering its own AI-assisted explanations of results alongside trend tracking. Both are genuinely useful additions, and both are a meaningful signal that the labs themselves recognize how confusing a raw report can be to the person actually receiving it.
The real limitation of either tool is scope, not quality: each one only knows about results that live inside that specific company's own app. If you've ever been tested through Quest for one panel and Labcorp for another — which happens constantly, since your insurance network, your employer's wellness program, or simply which doctor ordered which test can determine which lab you land at — neither AI companion can see the full picture across both. That's less a criticism of either tool and more a structural fact worth knowing if you've collected results from more than one network over time.
Whether your results came from Quest, Labcorp, or both, you can get every value from any report explained together in one place. Upload your results for a complete, plain-language breakdown in under 15 minutes.
Analyze My ResultsThe "Performing Lab" Line That Confuses People Most
Of everything on either report, the line that generates the most unnecessary alarm is the one listing the "performing lab" — because it's frequently a different name and address than the clinic, hospital, or draw site where you actually had your blood taken. This is completely normal and doesn't mean anything went wrong with your sample. Both Quest and Labcorp operate networks of dozens of regional and specialty laboratories, and routine tests are often processed at whichever facility is fastest and most efficient to route to, while specialized or less common tests are frequently sent to a small number of dedicated reference labs built specifically for that kind of analysis — sometimes in an entirely different state. Seeing an unfamiliar lab name and address on your report simply means your specific test needed equipment or expertise that isn't stationed at every single draw location, not that your sample was mishandled or sent somewhere it shouldn't have been.
Step-by-Step: How to Actually Read Your Own Report Right Now

With the terminology out of the way, actually reading your own report becomes a short, repeatable process. Start at the top of each row and identify the test name first, then find your result and its unit directly beside it. Next, locate the reference range or interval printed on that same line — not a number you remember from a different report or a general chart you found online — and compare your result against it. Check whether a flag appears; if none does, that value sits inside the expected window for that specific lab's method. If a flag is present, note whether it's a single letter (H or L, meaning outside the routine range) or doubled (HH or LL, meaning critical and almost certainly already flagged for provider follow-up). Repeat this same four-step scan for every row on the page, and keep a short list of anything flagged so you arrive at your next conversation with your provider already knowing exactly what to ask about, instead of trying to process the entire page in the moment.
Frequently Asked Questions
Are Quest Diagnostics and Labcorp results equally accurate?
Yes — both are large, accredited commercial laboratory networks. Differences you see between them come from different assay methods, equipment, and reference populations, not from one network being less reliable than the other.
Can I use one lab's reference range to interpret a result from the other lab?
No. Always compare your result to the reference range or interval printed on that specific report, since the same test can carry a genuinely different "normal" window depending on which network's method and equipment produced it.
What's the difference between the H/L flags and the AI tools each company now offers?
Flags are an automatic, statistical marker generated the moment a result is finalized. The AI companion tools (Quest AI Companion and MyLabcorp's AI features) go further, offering plain-language explanations and multi-year trend analysis — but only for results stored in that specific company's own app.
What does "performing lab" mean if it's not the location where I had blood drawn?
It's simply the specific facility within the network that actually ran your test, which is often a different location than your draw site, especially for specialized tests. This is standard practice and doesn't indicate any problem with your sample.
Conclusion
Once you know the anatomy both reports share, the terminology that actually differs between them, and why the printed "normal" range can genuinely shift from one network to the other, neither a Quest nor a Labcorp report should feel like it's written in a foreign language anymore. If you'd like every value from either — or both — pulled together into one plain-language read, that's exactly what LabsFive is built for: purely informational, and never a replacement for the conversation you have with your own doctor.
Still Not Sure What Your Results Mean?
Upload your labs and get a complete, visual, plain-language interpretation of every biomarker — delivered to your inbox in under 15 minutes.
Get My ReportThis article is for educational purposes only and does not constitute medical advice. Always consult your healthcare provider regarding your specific lab results. Quest Diagnostics and Labcorp are referenced here by name for informational purposes only; LabsFive is not affiliated with either company.